
5 Tips for Vendor Risk Management: Protect Your Organization
Data Modelling is designing, creating, documenting, and modifying data models representing real-world entities and their relationships. Data Modelling has been around for decades, but it has seen a resurgence in recent years due to the increasing volume and variety of data (known as big data). Data Modelling is now seen as a key component in developing data-driven systems. Among different kinds of data modellings, the dimensional data model provides a method for making databases simple and understandable.
In this blog, you will find:
The Difference between OLTP and OLAP Systems
Guide to Dimensional Modelling
Boost Workplace Productivity through Insight and Automation
ProServeIT Academy: Data Analytics Course
In this blog, we will introduce you to Dimensional Modelling and guide you on how to use the model according to your digital assets and needs.
You may be interested in these blogs:
Load Excel Spreadsheets to Structured Databases with Azure Data Factory: Step-by-step
Power BI Usage Metrics Across All Workspaces: Step by Step
The Difference between OLTP and OLAP Systems
OLTP, online transaction processing, can rapidly execute many transactions at once and is typically used for daily transactions, e-commerce and other web-based applications. OLAP, online analytical processing, is used for large data queries to allow faster retrieval, typically using data warehousing and business intelligence applications for analysis and reporting.
Both OLTP and OLAP have their advantages and disadvantages. OLTP is better suited for applications that need to store data in a structured way, while OLAP is better suited for applications that need to store data more flexibly. Let’s dive deeper into their differences and find the system that suits your needs.
OLTP (Online Transactional Processing) 🧾
☑️ Can rapidly execute transactions at the same time
☑️ Typically runs many smaller transactions (often writes to the database)
☑️ Third Normal Form (3NF) is the primary type of data Modelling in OLTP systems which normalizes data to reduce duplication of data and help avoid data anomalies
☑️ Use-Cases: Enterprise resource planning (ERP)/ Customer relationship management (CRM), online banking, shopping, website backends
OLAP (Online Analytical Processing) 🔎
☑️ Can query data for analysis
☑️ Typically for larger data queries (large reads from the database)
☑️ Dimensional Modelling (also known as the Star Schema) is one of the most used types of data modelling in OLAP systems, which ‘denormalizes’ data to allow for faster retrieval and a more human-understandable data model.
☑️ Use-Cases: data analysis, reporting
Guide to Dimensional Modelling
Dimensional Modelling is the primary data modelling in OLAP. Here, we will go through the definition of dimensional modelling, its benefits, and a four-step process to use the model one by one.
What is Dimensional modelling? 💡
Dimensional modelling is a data warehousing technique that organizes data into facts and dimensions. Facts are numeric measurements, such as sales revenue and events, while dimensions are the attributes of those facts, such as time, product, and location. By organizing data in this way, you can more easily analyze it to make better decisions.
It is best to reuse existing dimensions where possible to allow for drill-across and drill-down functionality and "plug" new fact tables into the enterprise bus architecture, which provides the underlying architecture for an enterprise-wide data warehouse.
Benefits of Dimensional Modelling 📝
🧠 Understandability: Compared to the other database models (i.e. normalized), the dimensional model (a.k.a. Star Schema) is easier to understand and more intuitive, which makes it ideal for self-serve reporting. In dimensional models, information is grouped into coherent business categories or dimensions, making it easier for data analysts and business users to read and interpret. Simplicity also allows the software to navigate dimensionally modelled databases efficiently. In normalized models (as opposed to a dimensional model), data is divided into many discrete entities. Even a simple business process might result in dozens of tables joined together in a complex way, making analyzing and reporting on data difficult without detailed knowledge of the underlying data structure.
📊 Query performance: Dimensional models are more denormalized and optimized for data querying (reading large amounts of data). In contrast, normalized models seek to eliminate data redundancies and are optimized for transaction loading and updating. The predictable framework of a dimensional model allows the database to make strong assumptions about the data, which may positively impact performance. Each dimension is an equivalent entry point into the fact table, and this symmetrical structure allows the effective handling of complex queries.
🎛️ Extensibility: Dimensional models are scalable and easily accommodate unexpected new data. You can change the existing tables by adding new data rows or executing SQL to alter table commands. You don't need to program any queries or applications on the data warehouse to accommodate changes, and old queries and applications continue to run without yielding different results. But in normalized models, you should consider each modification carefully because of the complex dependencies between database tables.
⏲️ Time to Value: Compared to other data warehouse design patterns, the Kimball Dimensional Model allows for smaller projects that provide value quickly while building an enterprise-wide data warehouse over time. Other data warehouse design patterns often require months to years of planning before starting implementation, and during this time requirements (and the business itself) frequently change.
✔️ Consistency: A core tenant of Dimensional Modelling is the idea of the conformed dimension, which is a dimension that has the same meaning to every fact with which it relates. Conformed dimensions allow facts and measures to be categorized and described similarly across multiple facts and data marts. They ensure consistent reporting across the enterprise, mitigating the risk of data silos and allowing for "drill-across" functionality. It will enable analysts to compare facts and measures across the enterprise.
Four-Step Process for Dimensional Modelling 🖇️
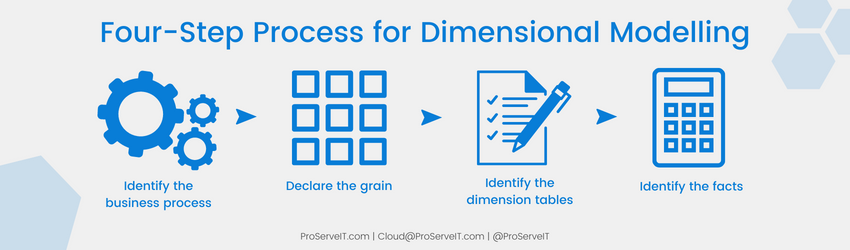 Step 1. Define the business process: Define the business process you want to track, which could be something as simple as sales data or something more complicated such as inventory data.
Step 2. Declare the grain: Declare the grain, the smallest data unit you want to track. For example, if you are tracking sales data, the grain might be a single sale.
Step 3. Identify the dimension tables: Identify the dimension tables containing information about the entities involved in the business process. For example, a dimension table for sales data might have information about customers, products, and employees.
Step 4. Identify the facts: Identify the facts and numerical data you want to track. For example, in a sales data set, the facts might be the quantity of products sold and the total sales price.
Boost Workplace Productivity through Insight and Automation
If you want to improve your business, start by collecting and analyzing data. With this valuable information, you can identify inefficiencies within your company, optimize efficiency among employees, and free yourself from doing the same tedious tasks repeatedly.
ProServeIT provides a Data & Analytics 3-Step Journey to help executive teams make well-informed, data-driven business decisions and increase overall profitability.
The Data and Analytics 3-Step Journey for business leaders:
Step 1. Discovery 🔎
Assess your current data practices, discover your data maturity level, build an implementation plan to “level up”, and understand costs and return on investment (ROI).
Step 2. Level-Up ☝️
For small and medium businesses: integrate data from multiple sources, create a “single source of truth” to make data-driven decisions going forward, and build a foundational data infrastructure.
For large enterprises: integrate data from multiple sources, create a “single source of truth” to make data-driven decisions as you advance, and build a foundational data infrastructure.
Step 3. Managed Service ⚙️
Continuously improve your data practices and ROI by getting weekly strategic advice from senior consultants and empowering all major stakeholders.
Learn more and contact us today to start your Data and Analytics journey with ProServeIT!
ProServeIT Academy: Data Analytics Course
 Our Data Analytics Course is designed for IT, Marketing, Sales, Finance, and Operations leaders. Join the third class of Data Analytics on December 13th regarding Power BI Reporting. ProServeIT’s Data & Analytics Practice Lead, Scott Sugar, will demonstrate live BI Reporting in the Power BI Desktop, including:
• Ingesting data into Power BI
• Transforming data in Power BI Query Editor
• Visualizing data
• Natural Language Q&A
• Built-In AI/ML Visuals
• Custom Visuals
Register for the Data Analytics course here.
Content from: ProServeIT Academy 2022 Microsoft Data Analytics Course 1 by Scott Sugar
Edited by: Betty Quon & Hyun-Jin Im

ProServeIT Corporation is a Toronto-based, leading IT solutions provider with over 20 years of experience helping businesses across various industries leverage technology to drive growth, enhance efficiency, and boost productivity. The blog and articles are authored by ProServeIT’s team of seasoned experts, sharing their insights and knowledge to help businesses stay ahead in the fast-changing tech landscape.


Comments