Be efficient with your time and reap the benefits of a more optimized workforce through insights & automation!

By collecting and analyzing data, you can gain valuable insights into your business operations, identify areas for improvement, optimize your workforce, and automate repetitive tasks. Do you want to take your business to the next level? Don't underestimate the power of data!

Data & Analytics 3-Step Journey     Customer Journey     Resources

As a certified Microsoft Solutions Partner Data & AI (Azure), you can be confident that we have the expertise to help you manage your data across multiple systems to build analytics and AI solutions.


Estimated data consumption from 2022 to 2025.

Data is and will continue to be a powerful force in the digital age.

As the world becomes increasingly digital, data will only become more important. The growth of digital technologies has meant that businesses now have access to more data than ever before. Businesses that embrace data and use it to their advantage will be the ones that succeed in the future. Just look at how much data is estimated to be consumed in 2022 compared to 2025! 

So what does this all mean for businesses? It means that they need to start focusing on collecting and utilizing data. Those that do, will be able to make better decisions and find new opportunities for growth.

Why should businesses invest in Data and Analytics?

Because businesses experience these common pain points:

 Significant manual effort to create reports using Excel

 Old, outdated reporting system

 Infrequent & inadequate reporting

 Mostly historical analysis

 Mostly gut-based decisions

 No "single source of truth"

Because businesses want to reap these desirable business outcomes:

 Reduce frustration by moving away from Excel

 Increase data accuracy

 Make well-informed, data-driven business decisions

 Utilize automation and AI to manage data and reports

 Increase overall profitability

What should businesses do to start their Data & Analytics Journey?

ProServeIT is here throughout your entire Data & Analytics Journey from discovery, to level up, and ongoing managed services.

Our team of certified Data & Analytics experts will work with you to build a plan for success that aligns your business objectives and IT strategy. We will help you accelerate your digital transformation journey to ensure that your Data & Analytics is reliable, secure, cost-effective, and scalable.

step-1-discovery

Step 1. Data & Analytics Discovery

Knowing where you start is critically important to ensure ROI.​
Starting at $8,000+


Click here for more details ➔

Data & Analytics Discovery

   $8,000+ 
   SMBs & Enterprise   
   3 Weeks

Assess your current data practices.
Discover your Data Maturity level.
• Build an implementation plan to “level up”.
• Understand costs and ROI.

step-2-level-up

Step 2. Data & Analytics Level Up

Now we know our starting point.
Let’s level up!
Starting at $20,000-$60,000+


Click here for more details ➔

Data & Analytics Level Up

   $20,000+
   SMBs
   Up to 1 Month

OR

   $60,000+
   Enterprise   
   Up to 3 Months

Integrate data from multiple sources.
Create “single source of truth” to make data-driven decisions going forward.
Build foundational data infrastructure.

step-3-managed-services

Step 3. Data & Analytics Managed Services

The Data journey is not one-and-done. It needs to evolve as your business continues to advance.
Starting at $10,000-$50,000+

Click here for more details ➔

Data & Analytics Managed Services

   $10,000-$50,000+/Month
   SMBs & Enterprise   
   Ongoing

Continuously improve your data practices and ROI by getting weekly strategic advice from senior consultants and empowering all major stakeholders. 

A Customer Data & Analytics Journey

A construction company levels up their business with the Data & Analytics 3-Step Journey.

business Construction     user 1,000+

 Business challenges they were experiencing: 

•  ERP System slowed down whenever the organization ran reports manually.
•  Manual data extraction from their ERP system and manual excel report creation caused inefficiency, inaccuracy, and frustration. 

 How they leveled up from Level 1: 

 Daily automated data extraction from the ERP system to data warehouse.
  Business analysis done by Power BI's built-in AI machine learning visualization capability.

 Taking it to the next level from Level 2: 

  Forecasting of their market and competitor analysis by bringing data from external data sources.


Fill out this form to get started with your  data & analytics journey 


How Our 3-Step Data & Analytics Journey Fits Within Your Technology Strategy
The roof of your Modern Technology House is Insights and Automation. Everything below the roof is an asset to your business. The data that you capture in your core business applications, or the data that you capture from your employees or customers enables you to make better decisions.
 
To have your data work for you, you need to efficiently collect and analyze it. The 3-Step Journey is a proven way to level up your data and analytics practices to use your data to grow your business, efficiently and effectively

tech roadmap house rooms

Don't get stuck in the roof...there are more rooms to explore!

Select one of the doors below to visit another room in The Modern Technology House.

The House - Cybersecurity Door

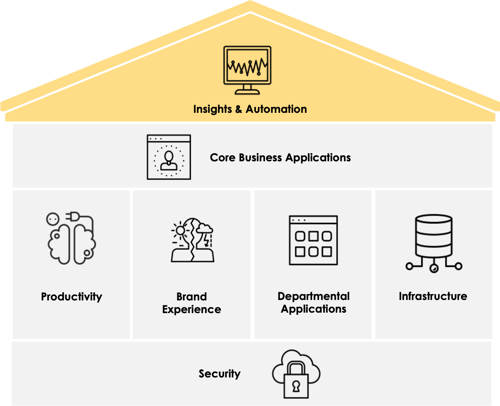
The Cybersecurity Room

In a world that’s built on technology, nothing is more important than having a solid security foundation.

Open the Door

The House - Infrastructure Door

The Infrastructure Room

Your path to effective devices, good networks, and connectivity to access all of your necessary applications.

Open the Door

The House - Business Applications Door

The Business Applications Room

Are you making the most of your business applications? Are your applications serving similar purposes? Can they be integrated?

Open the Door


The House Doors-03

The Productivity Room

Support your employees with the right productivity tools no matter where they work and what devices they work with.

Open the Door

The House Doors-04

The Brand Experience Room

A clear, comprehensive framework and the right technology enable your team to create a stellar brand experience.

Open the Door

Data & Analytic Resources for You

SharePoint to Dynamics BI blog-01
Use SharePoint to Add Dynamic Content to Your BI Report: Step by Step
PSIT Academy - Data Analytics Feat
ProServeIT Academy: Data & Analytics Course
Load Excel Spreadsheets to Structured Databases using Azure Data Factory-1
Load Excel Spreadsheets to Structured Databases with Azure Data Factory: Step-by-step