
Comparing Power BI and Excel: What’s the Best Business Analytics Tool?
In this blog, we will discuss how you can leverage Power BI workspaces to enhance usage metrics and analytics for your data visualization reports, dashboards, and datasets within the business intelligence domain.
As the saying goes, "You can't manage what you can't measure." Thus, it's crucial to track the performance of your reports and dashboards in the online Power BI service to manage your tenant's business intelligence capabilities better. By analyzing which data visualizations are gaining the most attention and from whom, you can gain valuable insights into optimizing your Power BI workspaces and their impact on reporting.
To achieve a unified view of usage metrics and performance tracking across the tenant, these metrics can be saved and edited at the report/dashboard level and unfiltered to display usage across an entire workspace. However, monitoring usage at the workspace level isn't scalable for organizations with multiple workspaces.
That's why utilizing the built-in Power BI usage metrics and analytics in the Admin portal is essential for obtaining comprehensive insights and effective reporting across your entire business intelligence infrastructure.
In this blog, you will find:
📊 Power BI Usage Metrics: Solution Walkthrough
🌐 Create Power BI Streaming Dataset
The Admin portal offers usage metrics, which may not be customizable or interactive. Instead of focusing on "who has how many reports/dashboards," the key is determining "who's using the service, and what are they looking at?"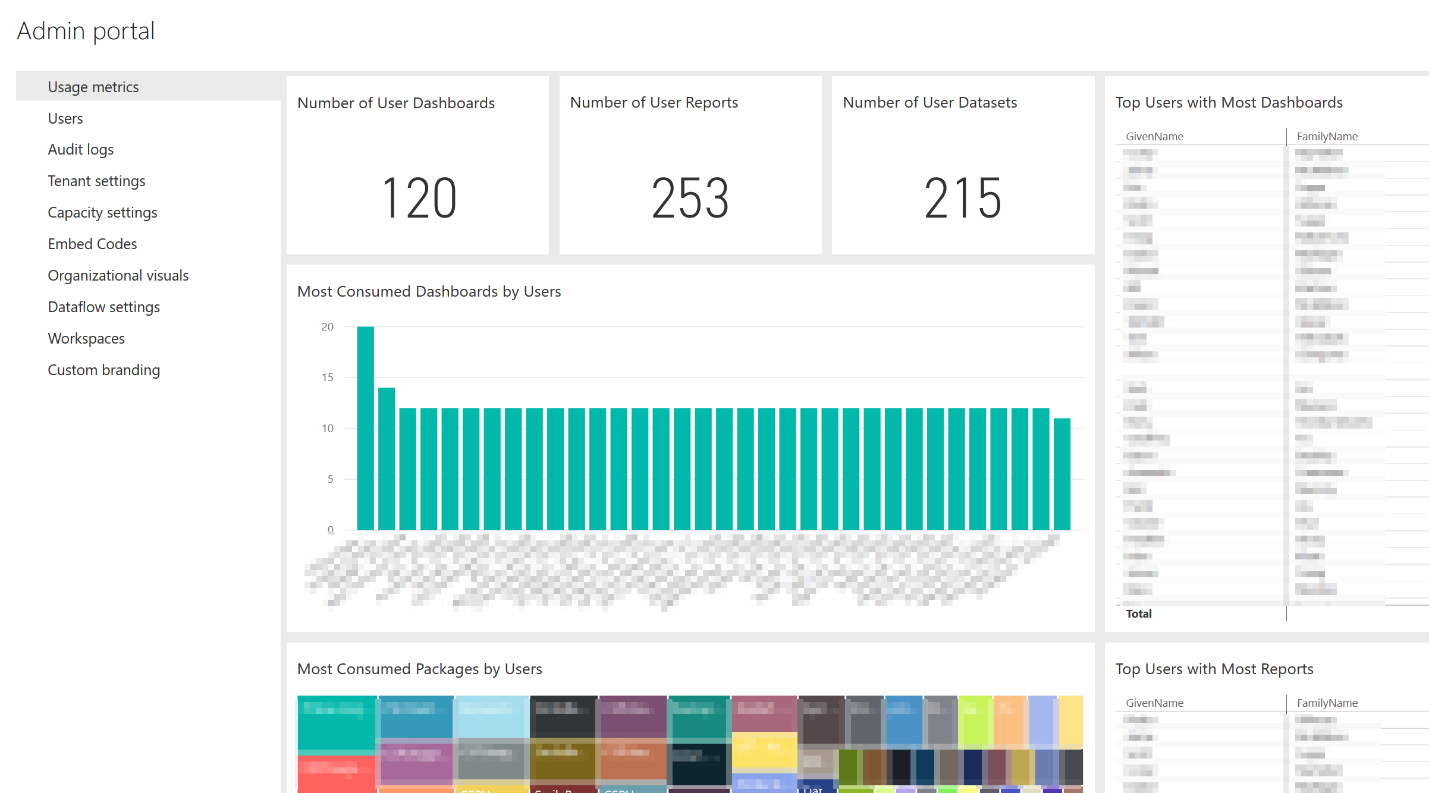 Therefore, this blog will delve into how to use Power BI workspaces to enhance the usage metrics of your Power BI service, with a specific focus on how to use the built-in usage metrics report for Power BI:
Are you ready to optimize your Power BI workspaces and unlock valuable insights? Eager to enhance your data visualization reports, dashboards, and datasets?
Get in touch with ProServeIT, and let us help you transform your business intelligence capabilities and performance tracking.
Don't wait – reach out to us today!

Power BI Usage Metrics: Solution Walkthrough
Set up Pre-Requisites
We have a few things we need to set up in order to get this solution working:
- Azure AD Global Admin account; A privileged account that has complete access to all Azure AD features and functionalities.
- Azure AD Application - to help us authenticate to the O365 Management APIs
- Power BI Streaming Dataset - to hold the Power BI activity logs
Create an Azure AD Application
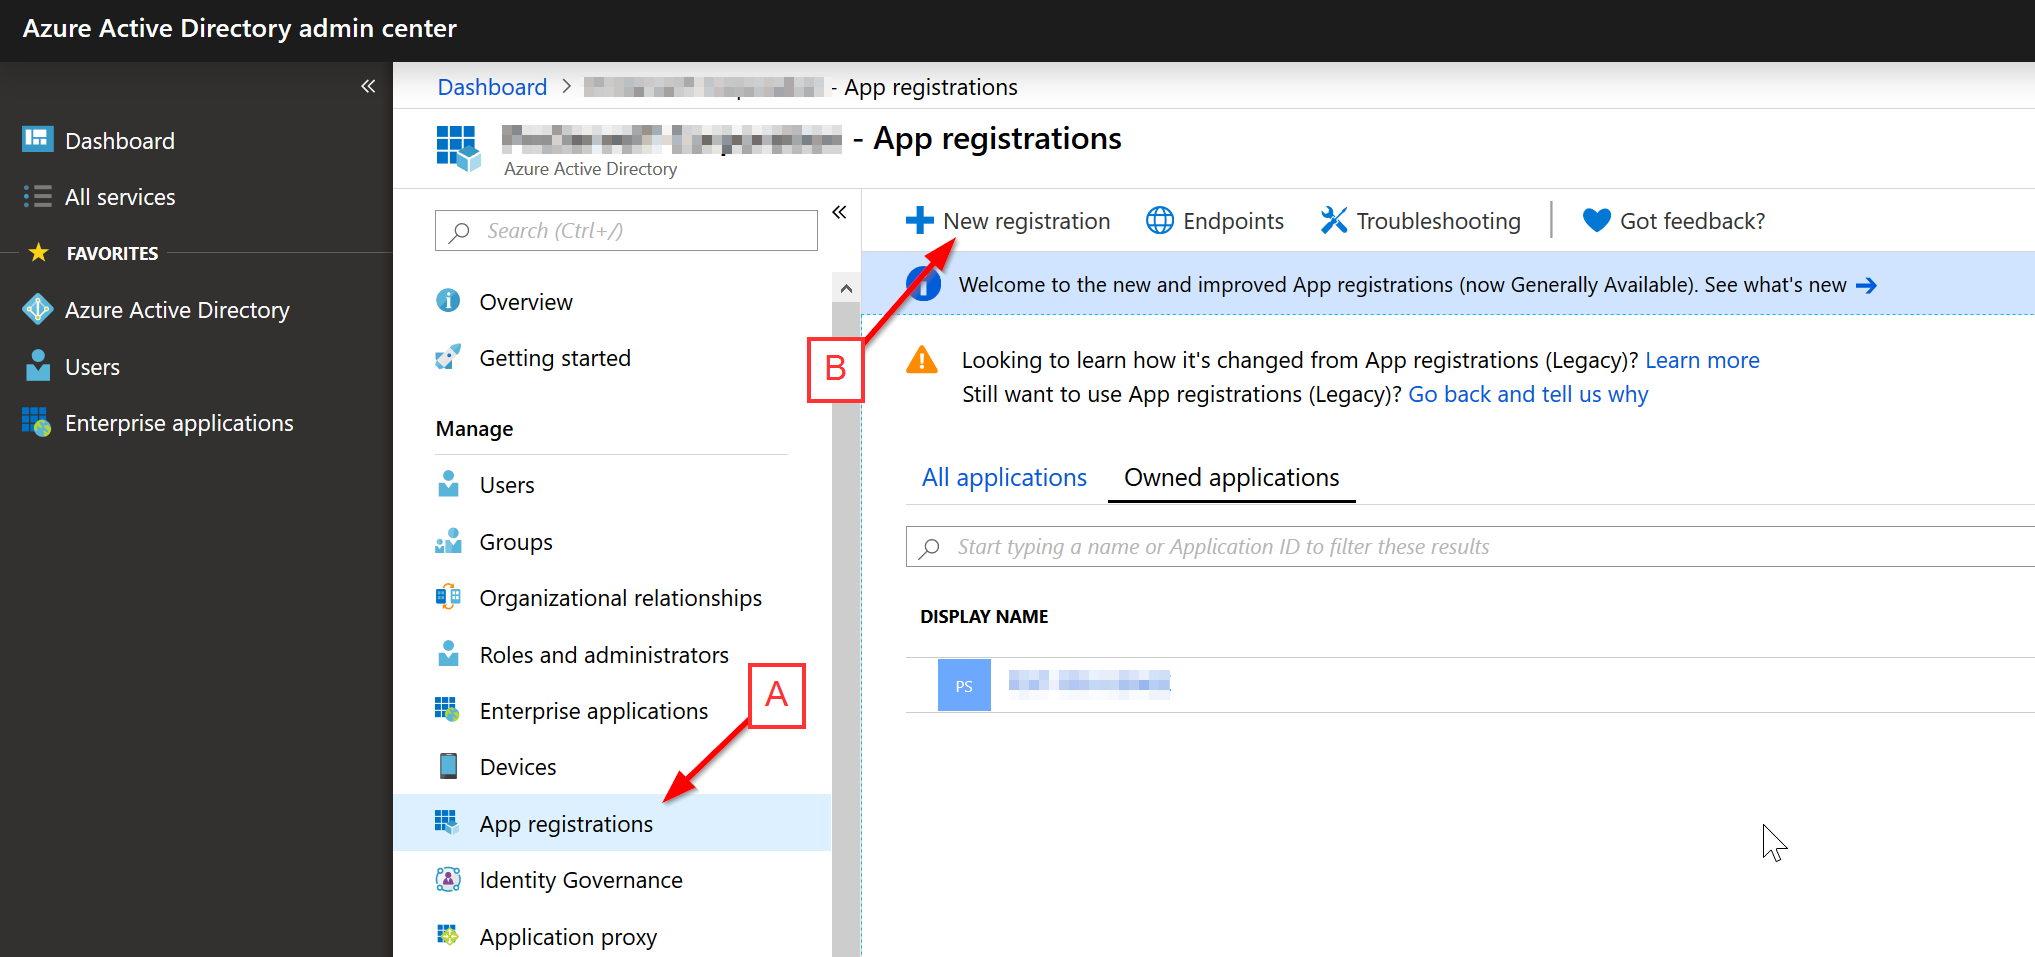
1. log in to Azure AD Admin Portal and Create a new Azure AD Application
- Click App Registrations
- Click New Registration
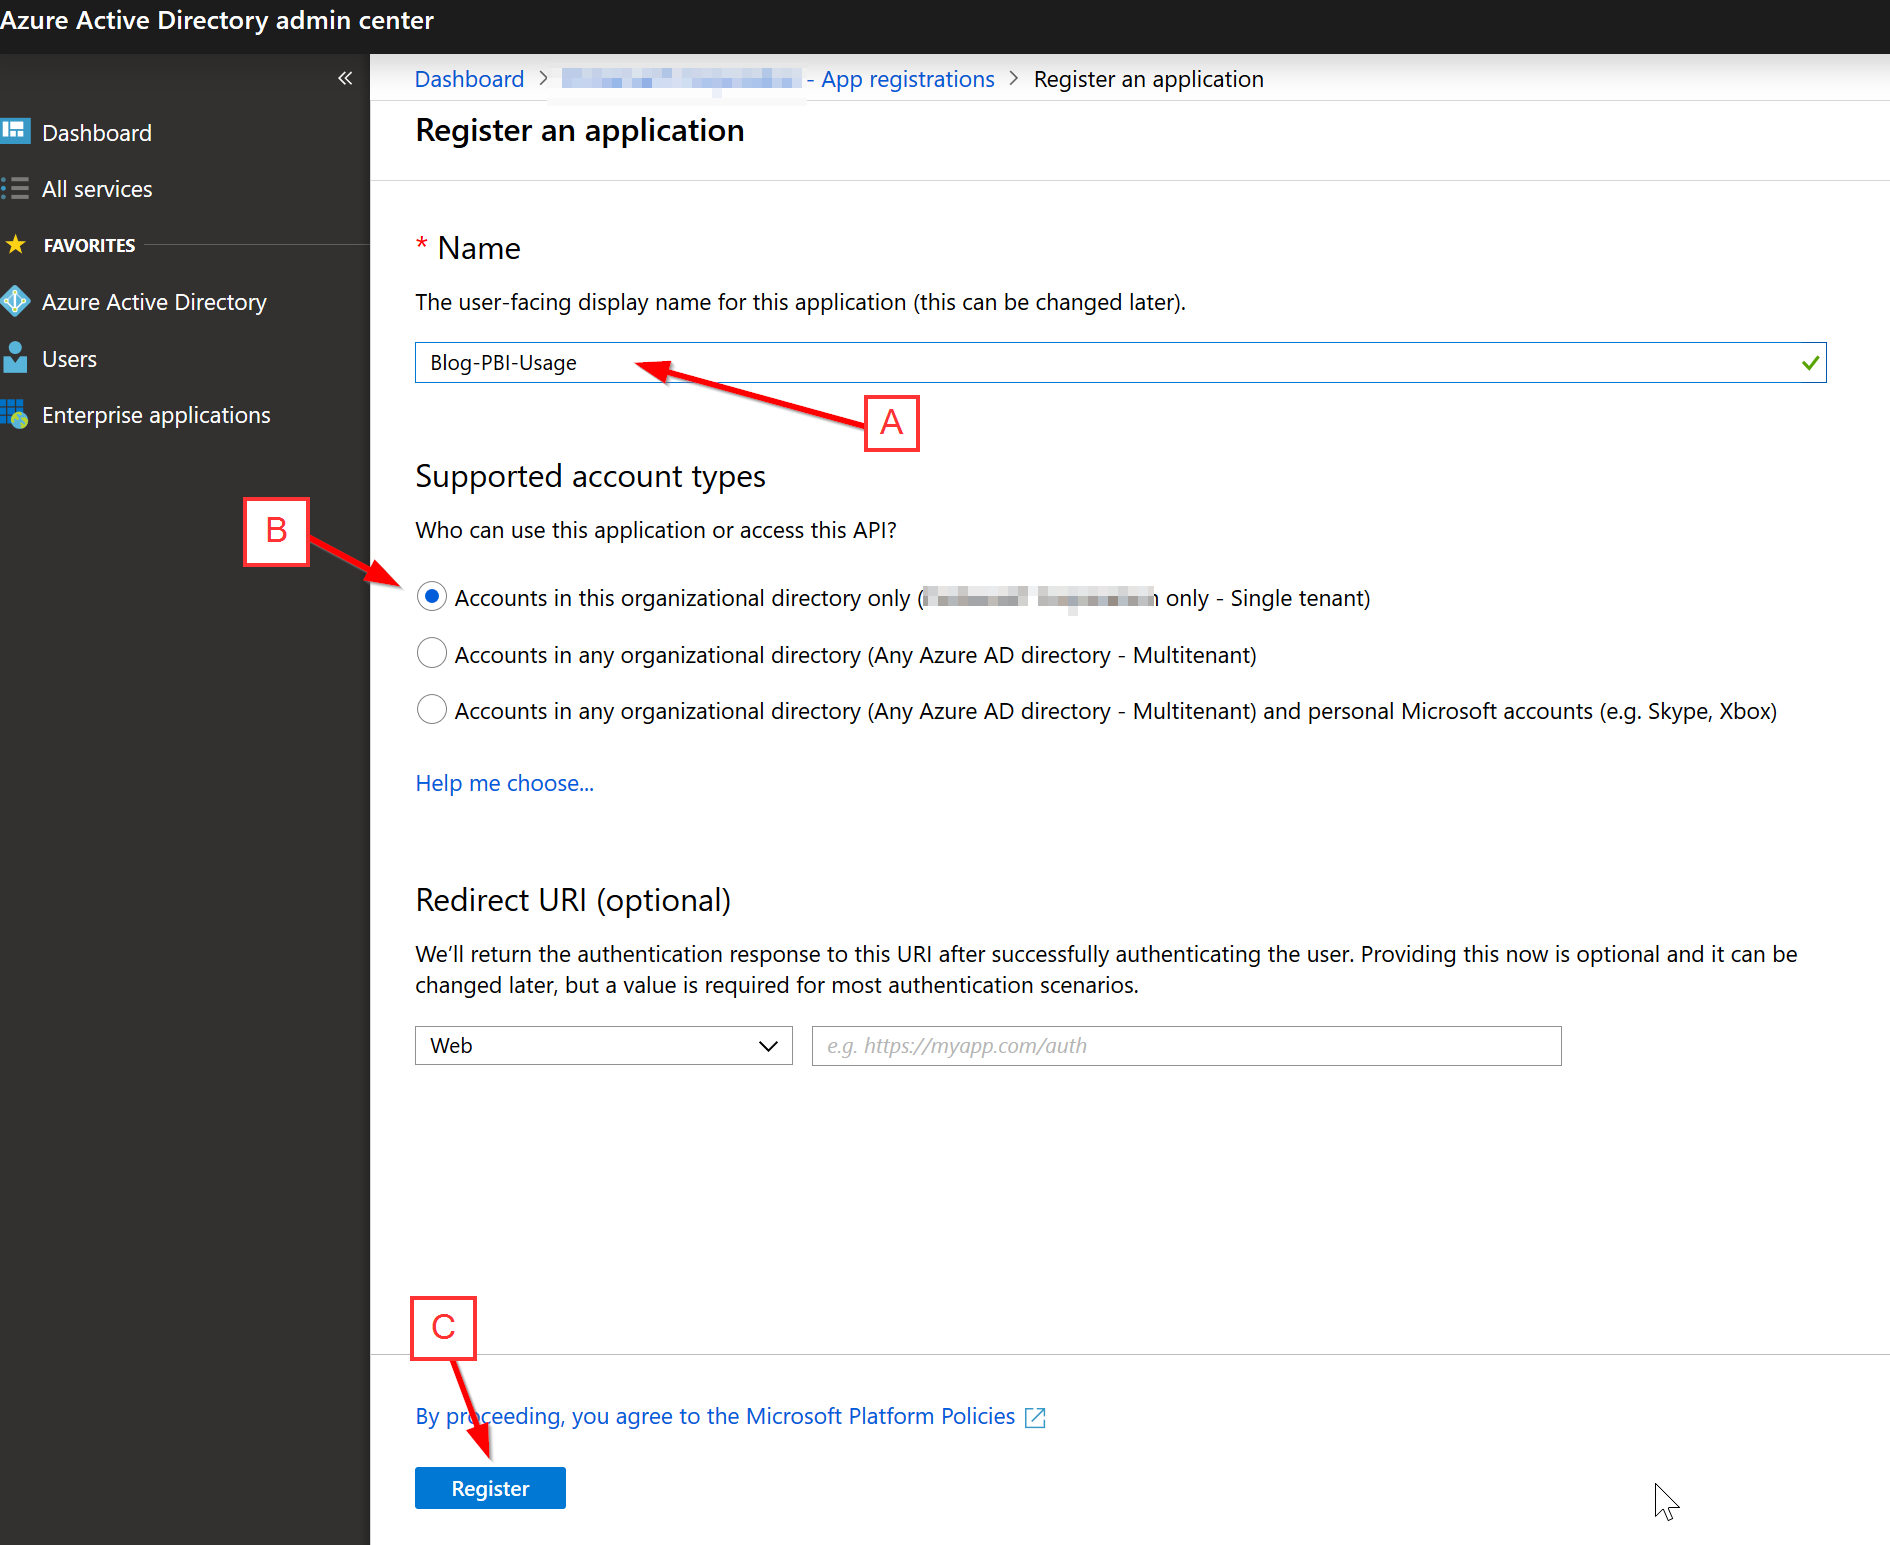
2. Register Azure AD Application
- Enter Application Name
- Select Supported Account Types (default is fine if gather activity logs for one tenant)
- Click Register
3. Add API Permissions
- Click API Permissions
- Click "Add permission"
- Click "Office 365 Management APIs"
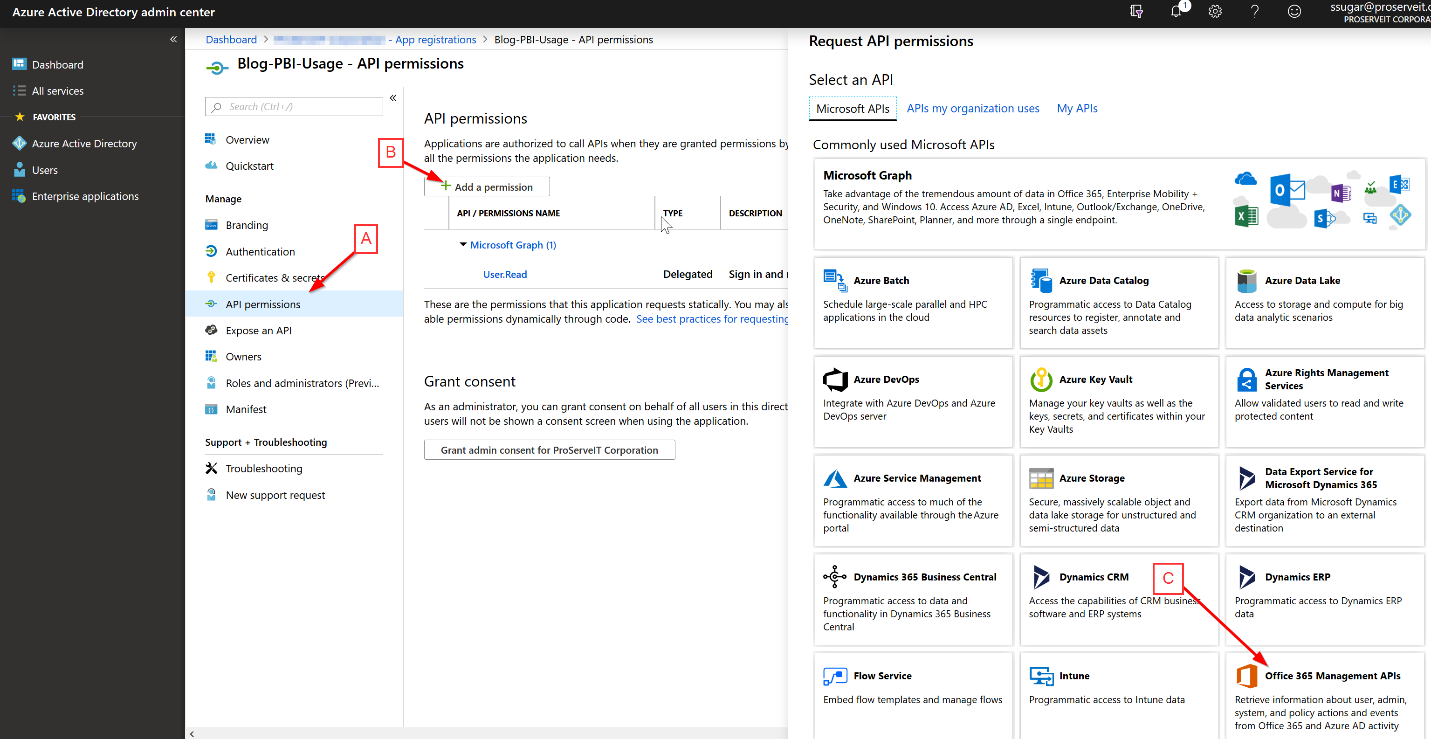
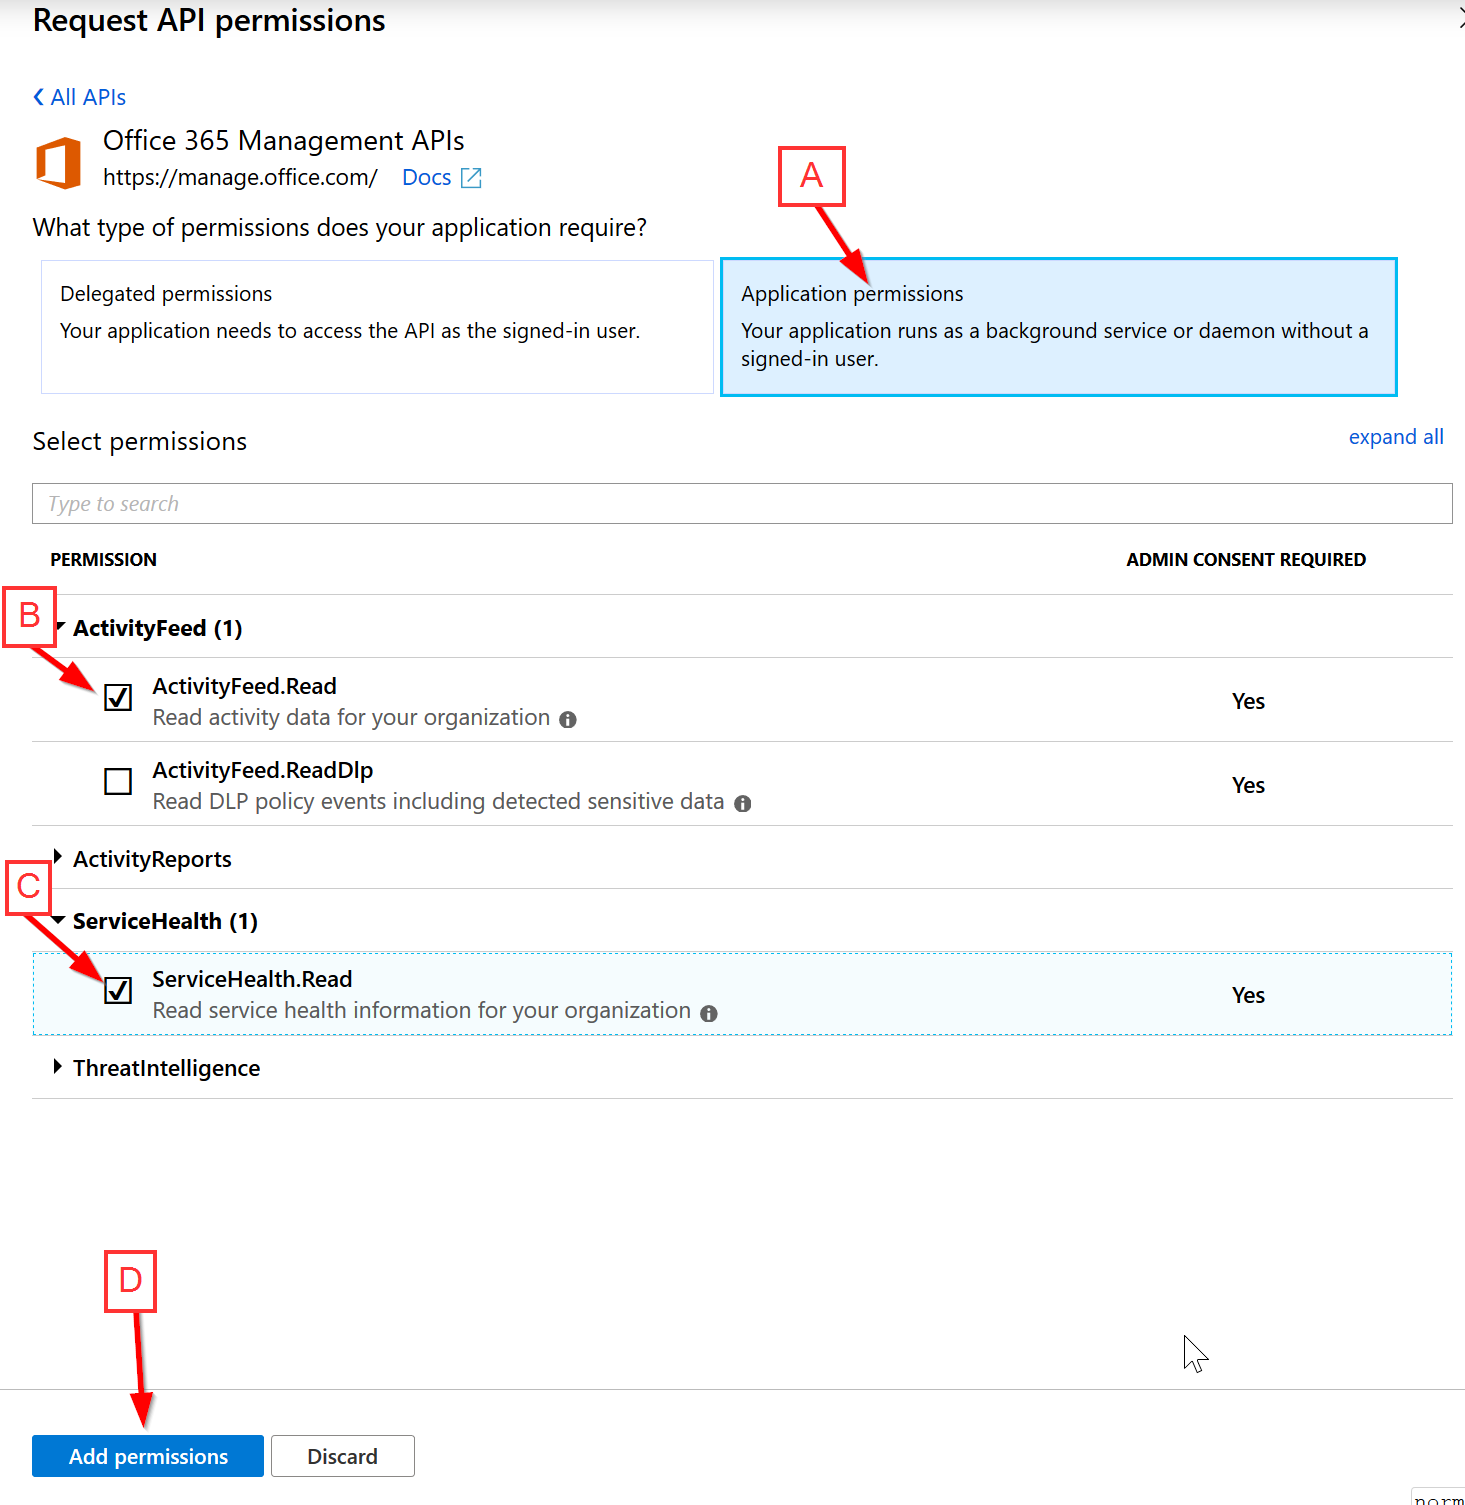
4. Request API Permissions
- Click "Application Permissions"
- Select ActivityFeed.Read
- Select ServiceHealth.Read
- Click "Add permissions."
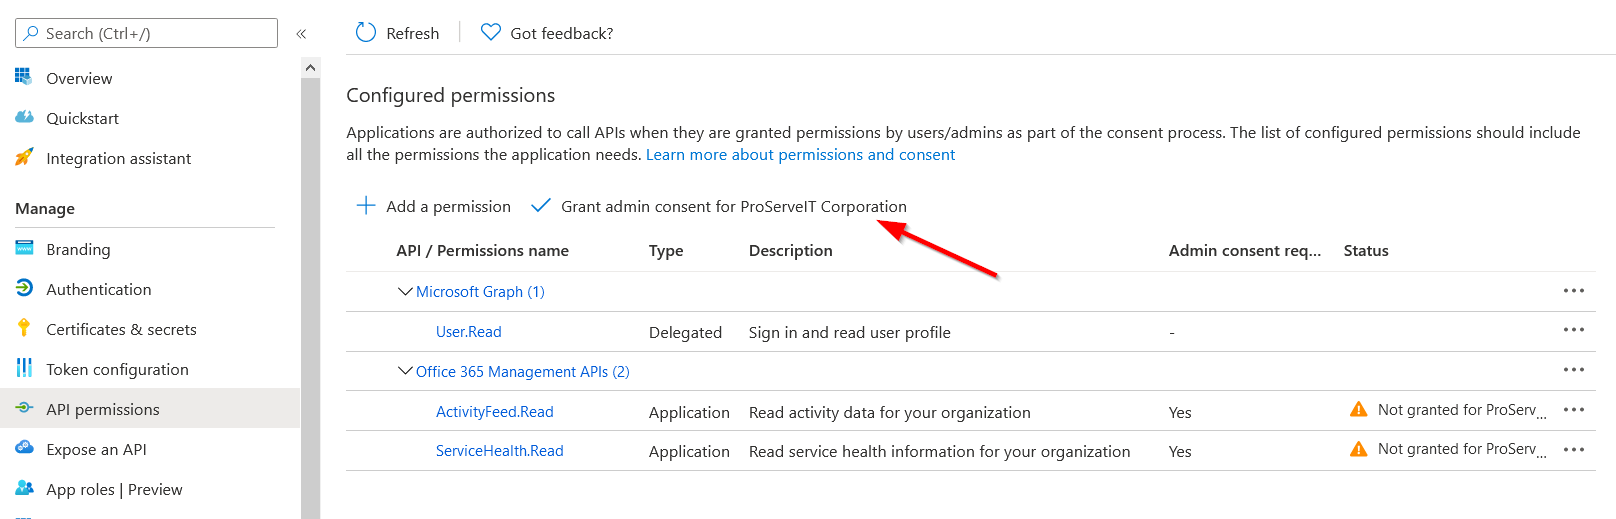
4a. Grant Admin Consent for your org
-
Click "Grant admin consent for ..."
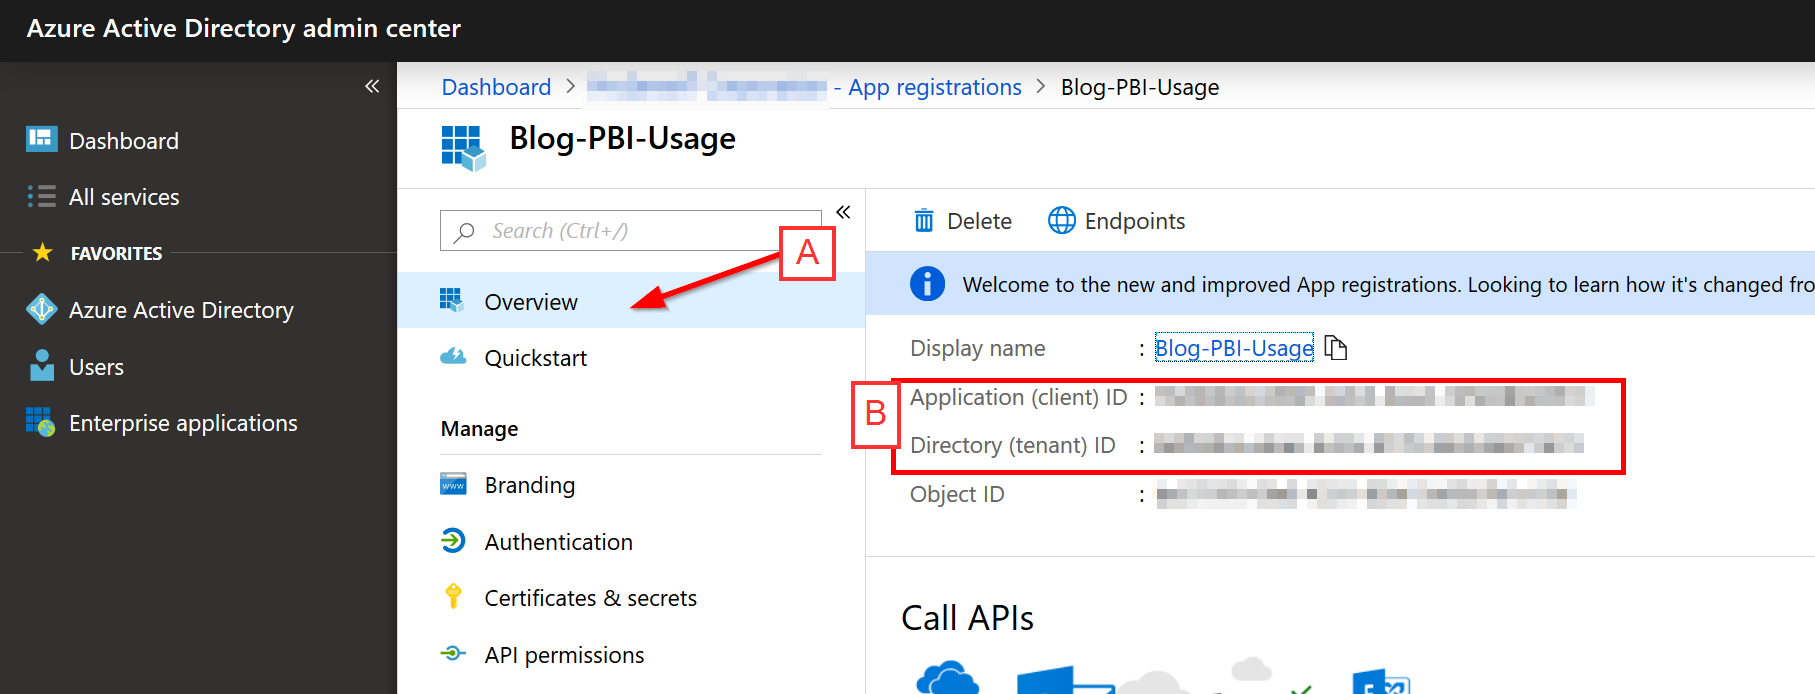
5. Gather Application (client) ID, and Directory (tenant) ID
- Click Overview
- Copy the Application ID and Directory ID into notepad for use later.
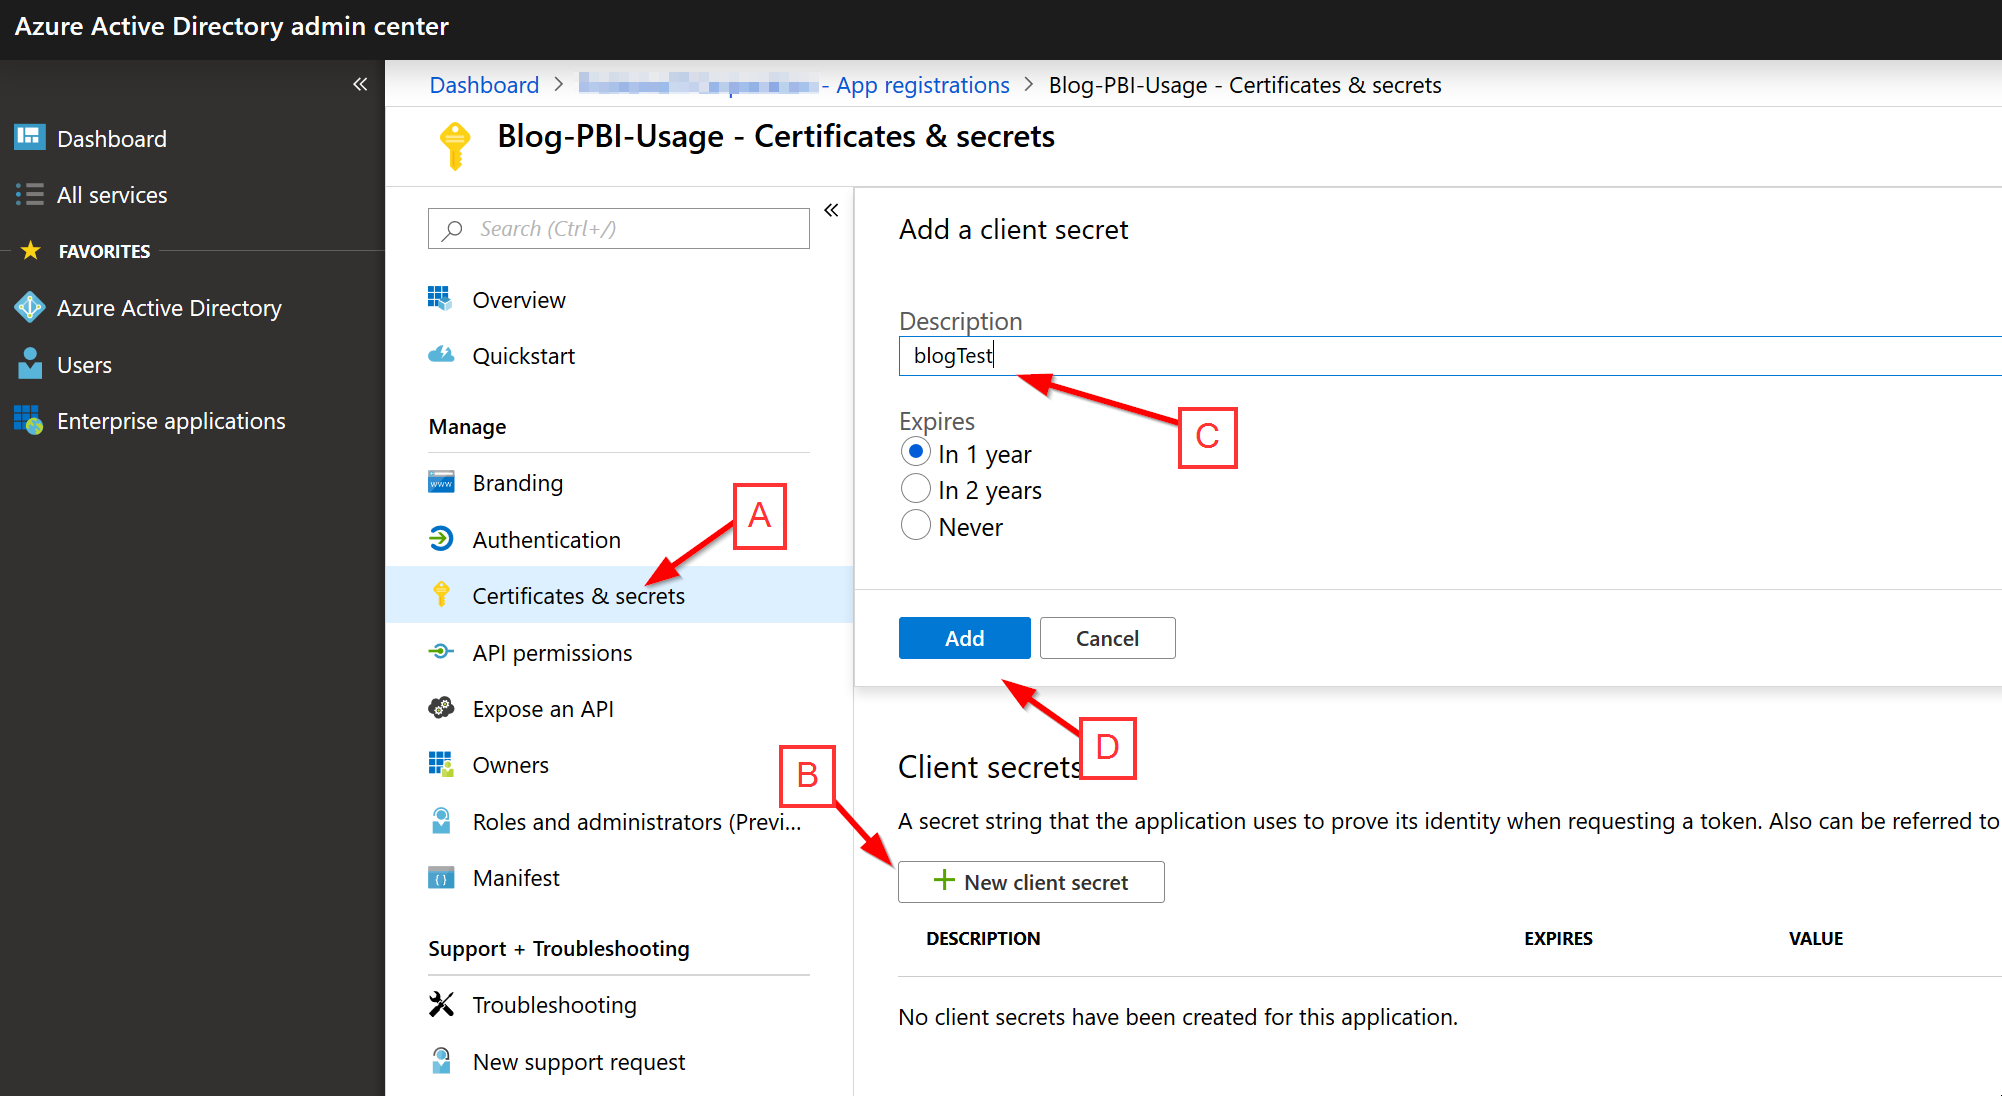
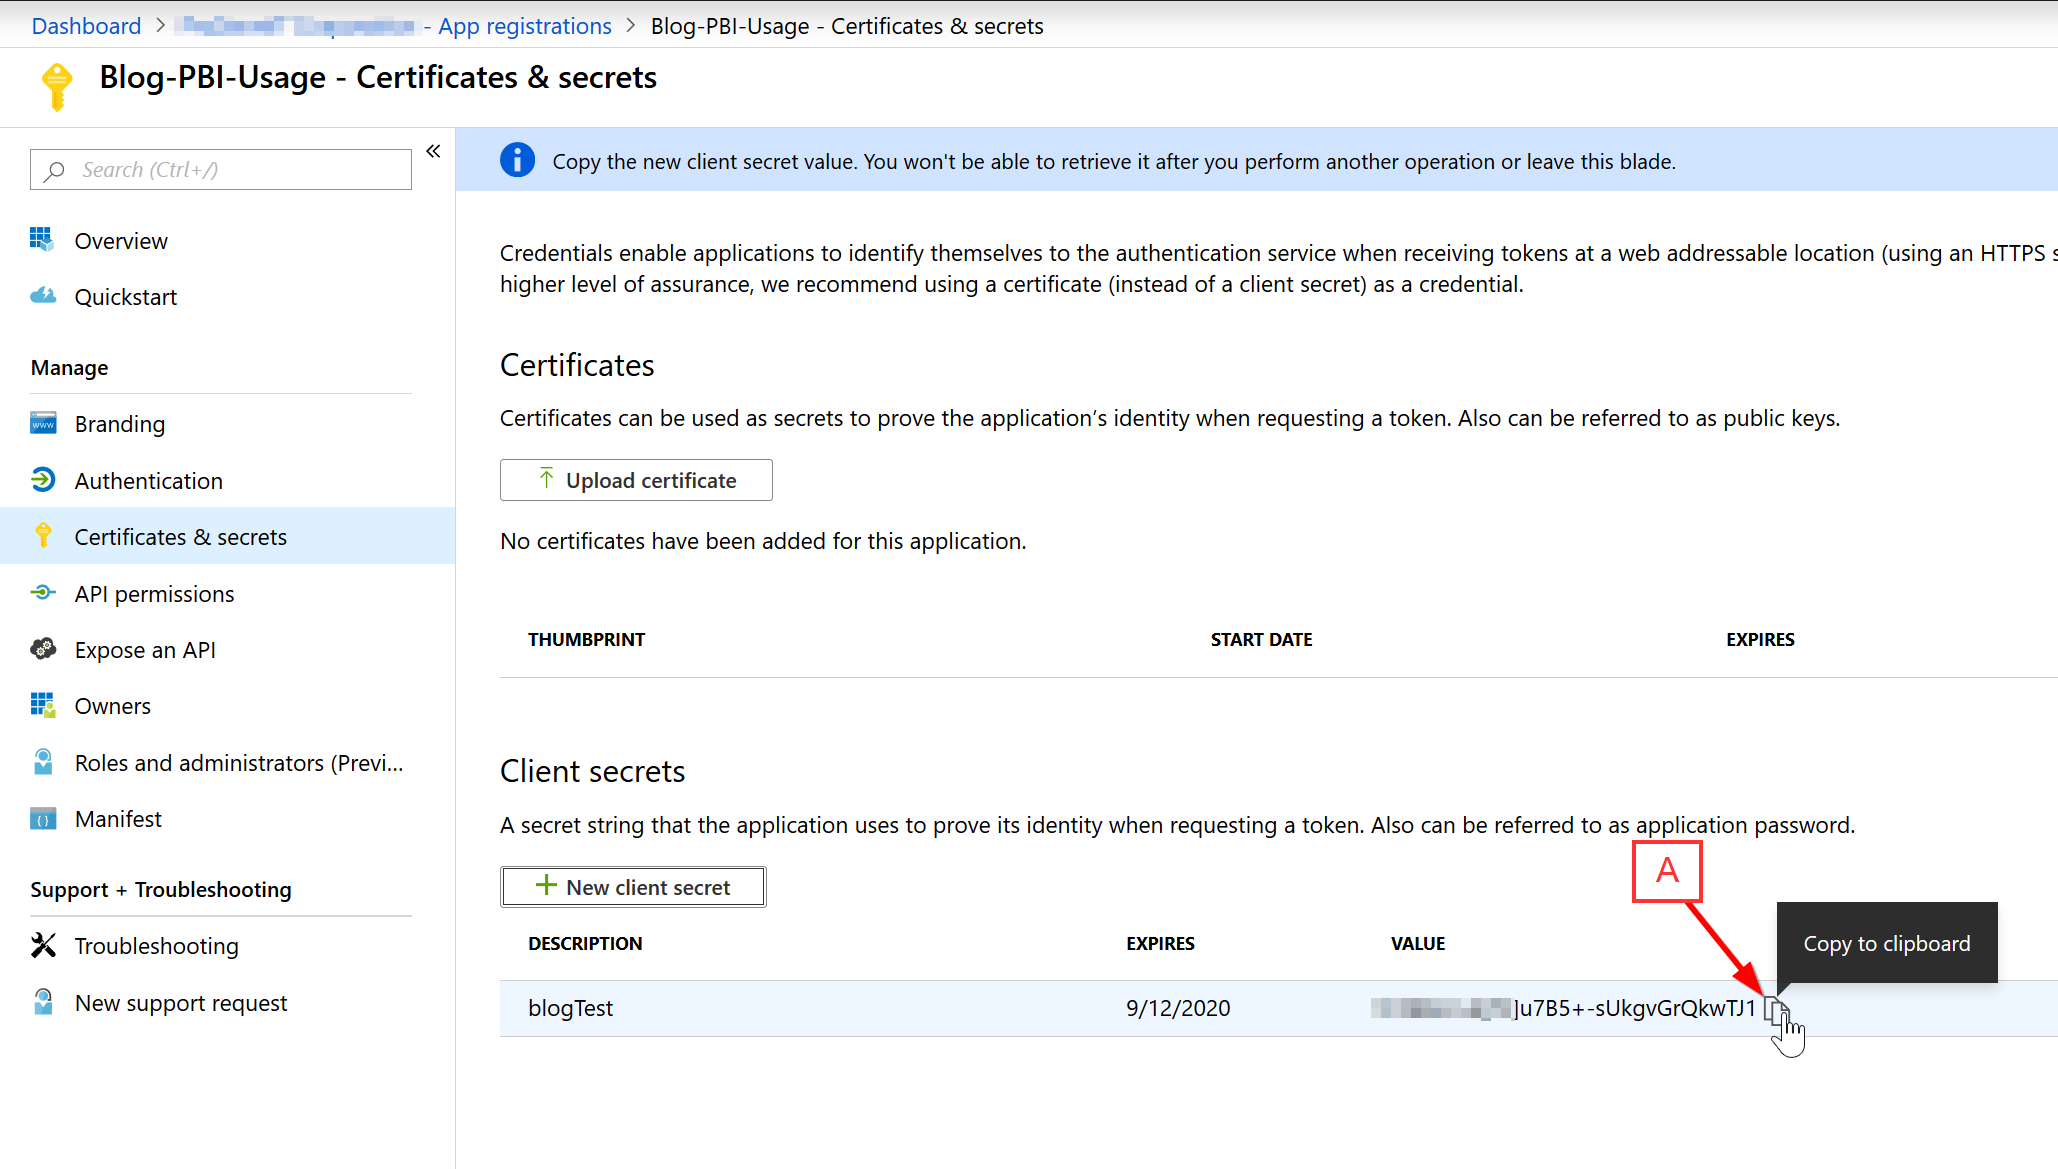
6. Create Client's secret
- Click Certificates and Secrets
- Click New client secret
- Enter a description
- Click "Add"
7. Gather Client's secret
- Copy the Client's secret into notepad for use later
Create Power BI Streaming Dataset
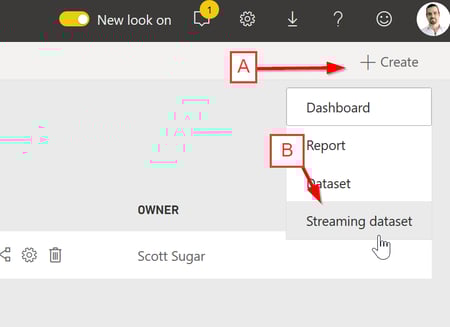
1. Create a Streaming dataset
- Click +Create
- Click on a Streaming dataset
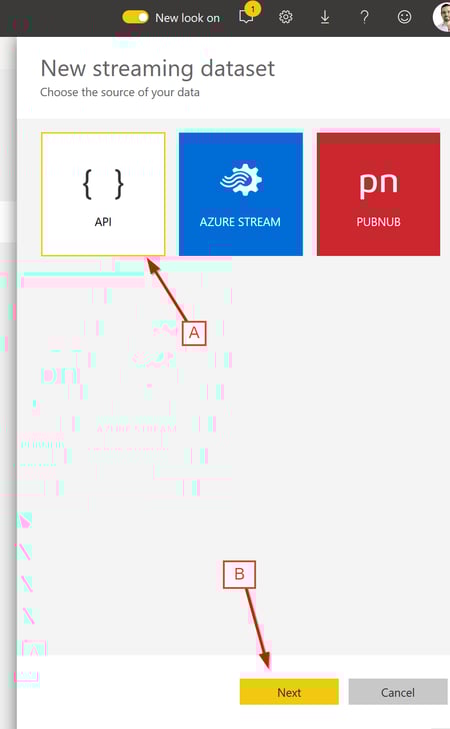
2. Select the data source
- Select API
- Click Next
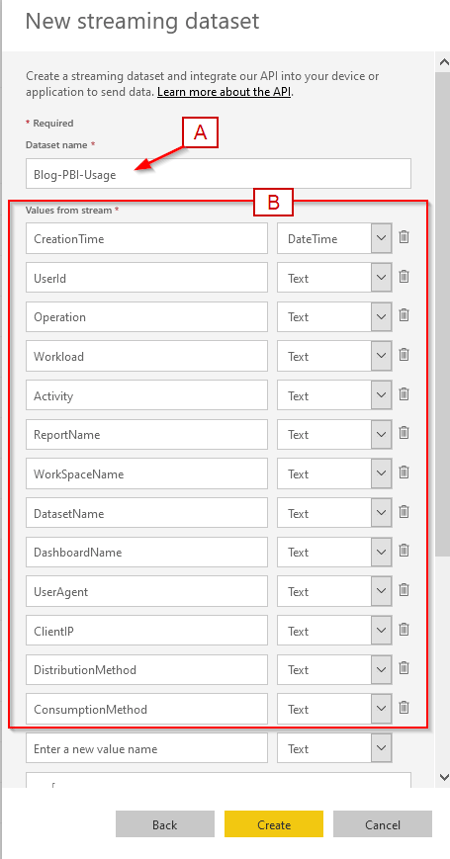
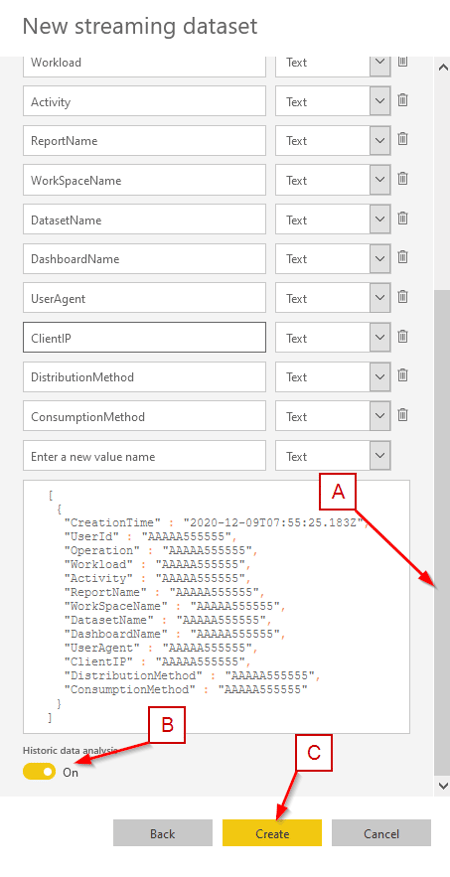
3. Enter dataset and field names
- Enter a dataset name
- Fill in the "Values from stream" section per the screenshot below.
Note: CreationTime is type DateTime; everything else is text.
4. Turn on historical data analysis and create the dataset
- Scroll down
- Enable "Historical data analysis."
- Click Create
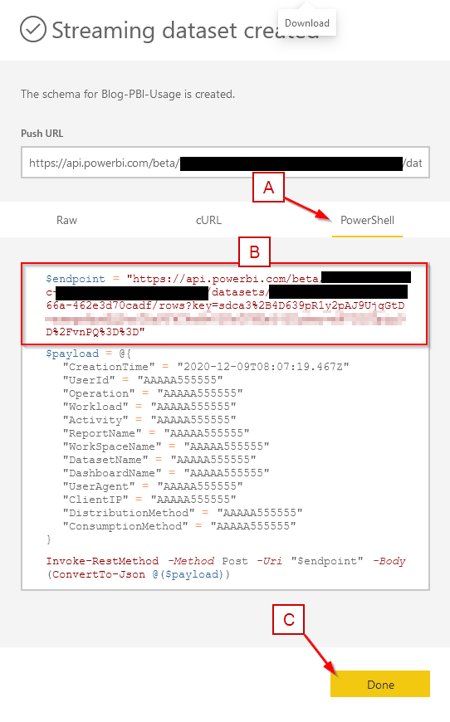
5. Gather PowerShell Code
- Click on PowerShell
- Copy the endpoint URL to notepad for use later
- Click Done
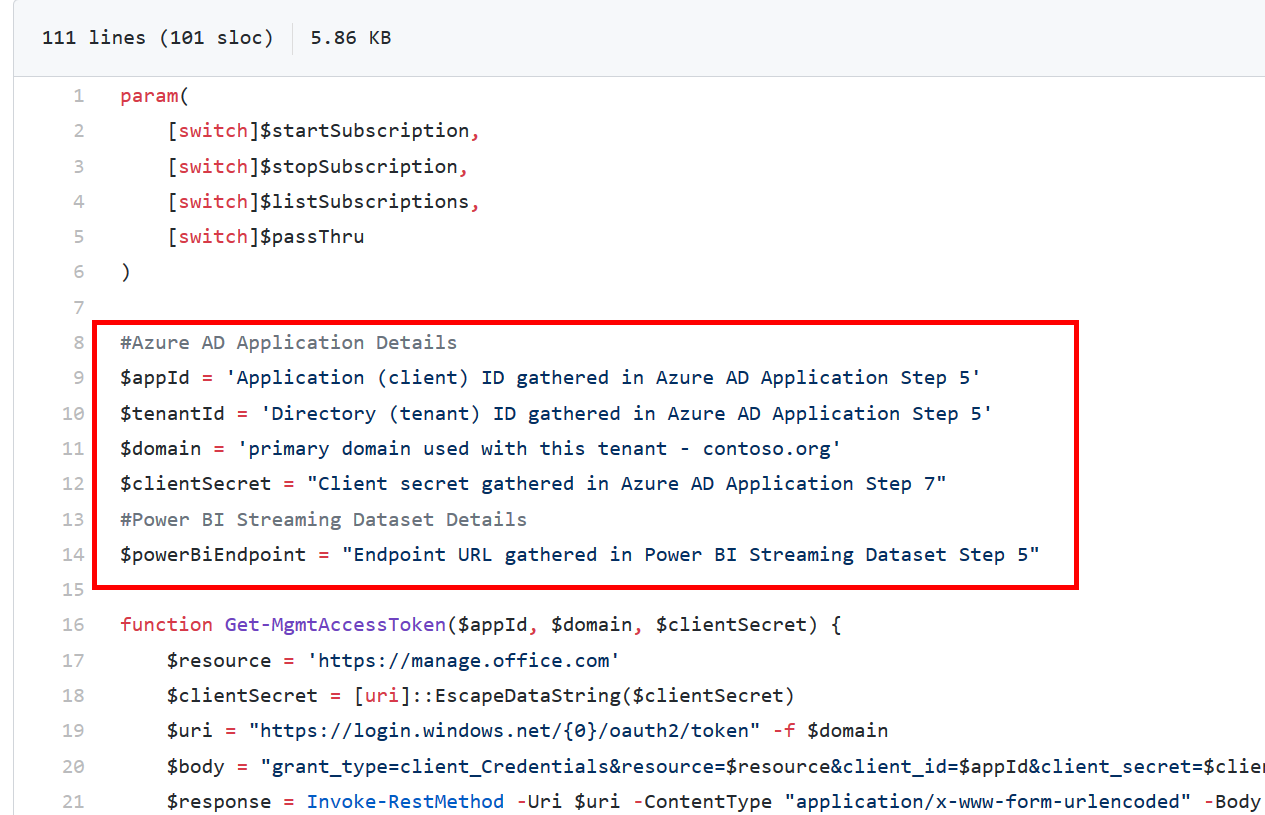
Get-PowerBI Usage Script
The PowerShell script we'll use to grab the activity logs from the O365 Management API and load the results into a Power BI Streaming Dataset can be found here. Please save the script to a folder on your computer, open up PowerShell and change to the same directory where you saved the script.
Update Script
Before trying to run the script, please update the variables at the top of the script with the values we copied into notepad.
Run Script
To start, you'll need to "create a subscription" so the Management API will start to save your tenant's activities for later retrieval.
.\Get-PowerBIUsage.ps1 -startSubscription
Loop Script
The code below will continue to look for available activity logs every 15 minutes and push the log entries into to the streaming dataset.
while($true){
  .\Get-PowerBIUsage.ps1
  Start-Sleep -Seconds 900
}
Create Power BI Report
At this point, you can start creating your Power BI report and answering some of our previous questions. As a start, let's look at what the most popular reports are in our tenant:
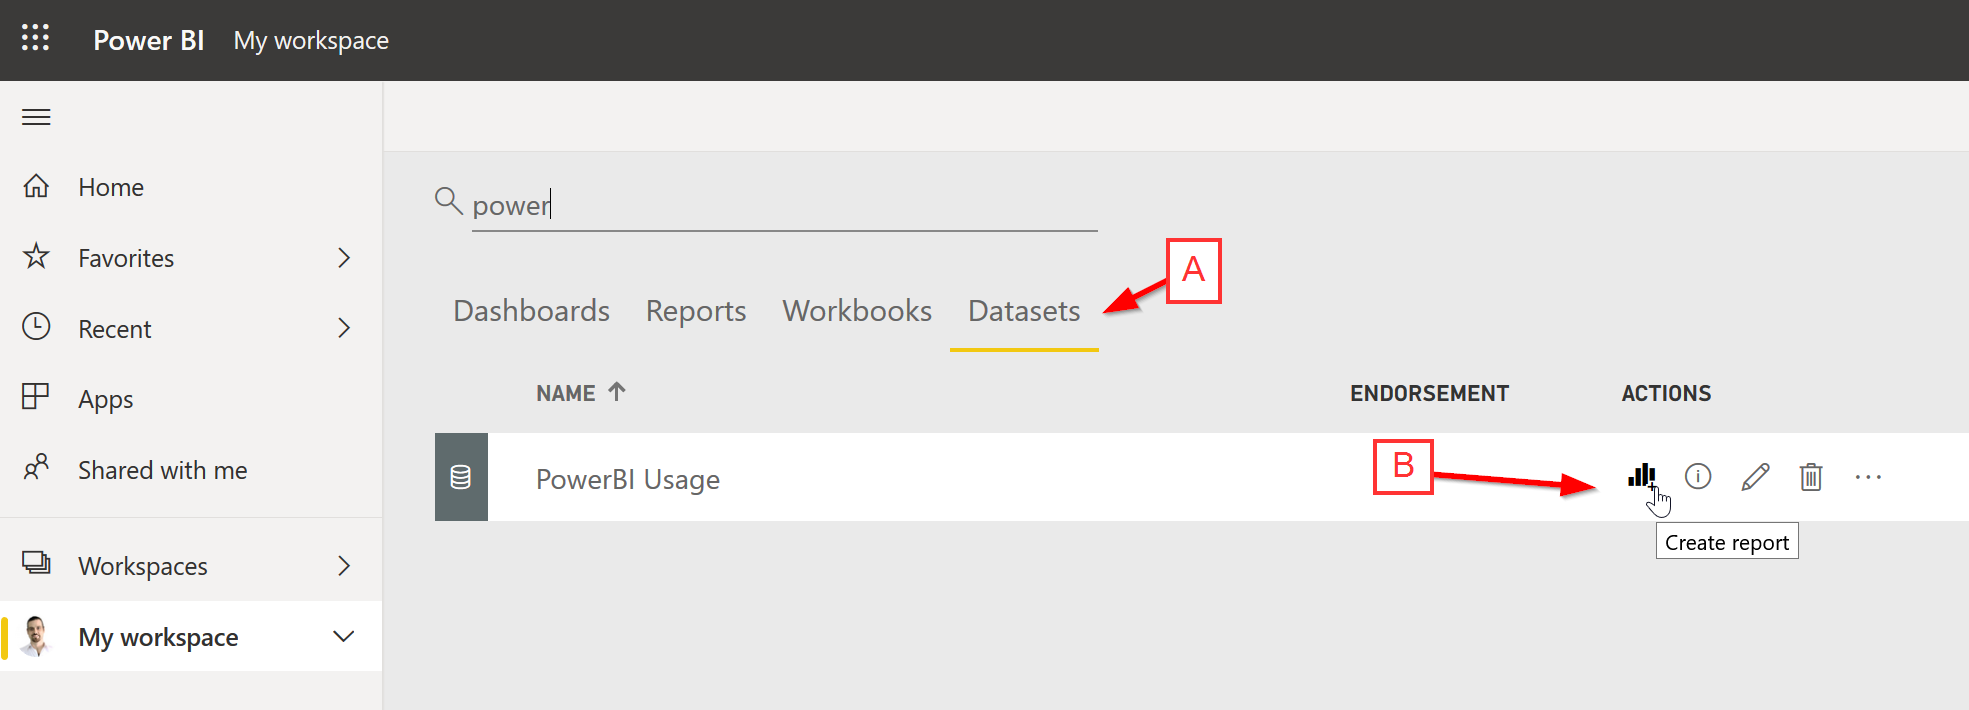
1. Create a report
- Click on Datasets
- Click on Create report
2. Create Top Operations by Report Name visualization
- Click on the "Stacked bar chart" visualization
- Drag and drop Report Name into the Axis
- Drag-and-drop Operation into the Value (will become count of operation)
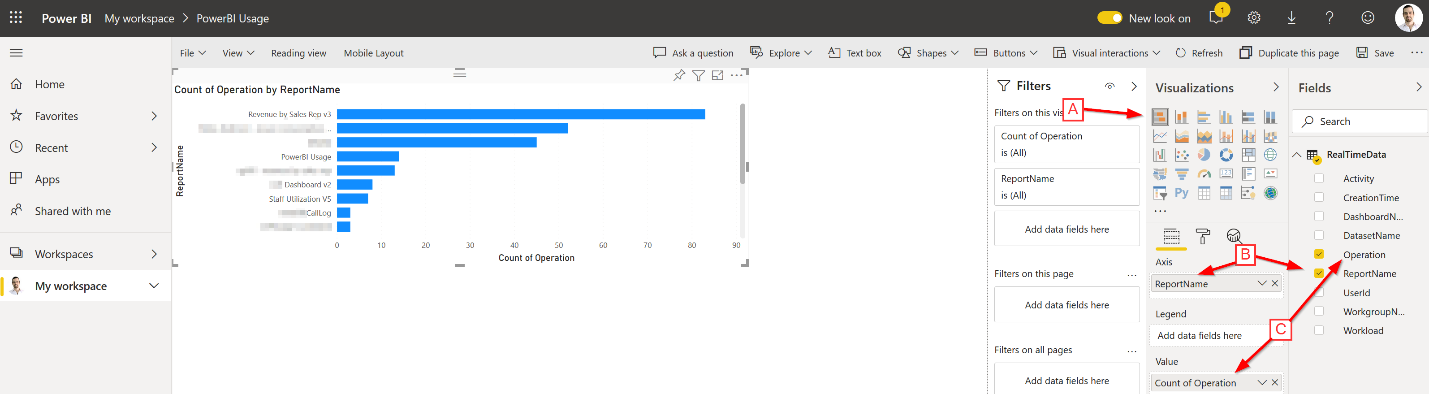
With the above in place, we can see that our "Revenue by Sales Rep v3" report is our most used (i.e., popular) report. From there, we can add slicers and other visualizations or tables to continue to delve into our tenant's Power BI usage and find out "who's using the service, and what are they looking at?".
Are you ready to optimize your Power BI workspaces and unlock valuable insights? Eager to enhance your data visualization reports, dashboards, and datasets?
Get in touch with ProServeIT, and let us help you transform your business intelligence capabilities and performance tracking.
Don't wait – reach out to us today!
Thoughts and Next Steps
This was a quick introduction to Azure AD Application authentication to the O365 Management Activity API and to loading Power BI activity data into a Power BI streaming dataset.
With some work, this could be expanded to capture other O365 activity data (Exchange, SharePoint, Teams, DLP, etc.) and could be used to save activity log information to long-term storage (instead of a streaming dataset).
Let us know what interests you, which will help us tailor our future technical blog postings. As always, if you have any issues or would like to ask us any questions, please reach out to us.


From the 1980's, when his father used to hand down old computer equipment, to now, Scott Sugar has always had a fascination with technology. The ability to communicate with people, regardless of distance or location, is, in Scott's opinion, one of the best things about tech. With over 20 years of experience in the IT industry, and 17 years at ProServeIT, Scott's areas of expertise include data & analytics, and IT operations, monitoring, and alerting. Scott heads up ProServeIT's Ho Chi Minh City, Vietnam office. He has spent the majority of his adult life in Asia, and speaks 3 languages.


Comments