
Comparing Power BI and Excel: What’s the Best Business Analytics Tool?
In this blog, I will be talking about how you can measure usage metrics across all workspaces using Microsoft Graph API. You can use PowerBI Service usage metrics in the admin portal to see the number of users/reports/dashboards but the question “who’s using the services/reports and what are they looking at?” is left unanswered. I have tried to answer the question here in this blog.
If you would like to do the same without the need to save the data in the data warehouse/lake using Powershell scripts and the PBI Streaming dataset please refer to this blog here.
In this blog you will find:
Step 1: Set up Pre-Requisites
Create an Azure AD Application
Register Your Azure AD Application
Add and Request API Permissions
Create an Azure AD Security Group and Enable the PowerBI Admin Settings
Step 2: Create an Incremental Pipeline in Azure Data Factory
Create Linked Services
Create Source and Sink Datasets
Create a Pipeline
Step 1: Set up Pre-Requisites
Create an Azure AD Application
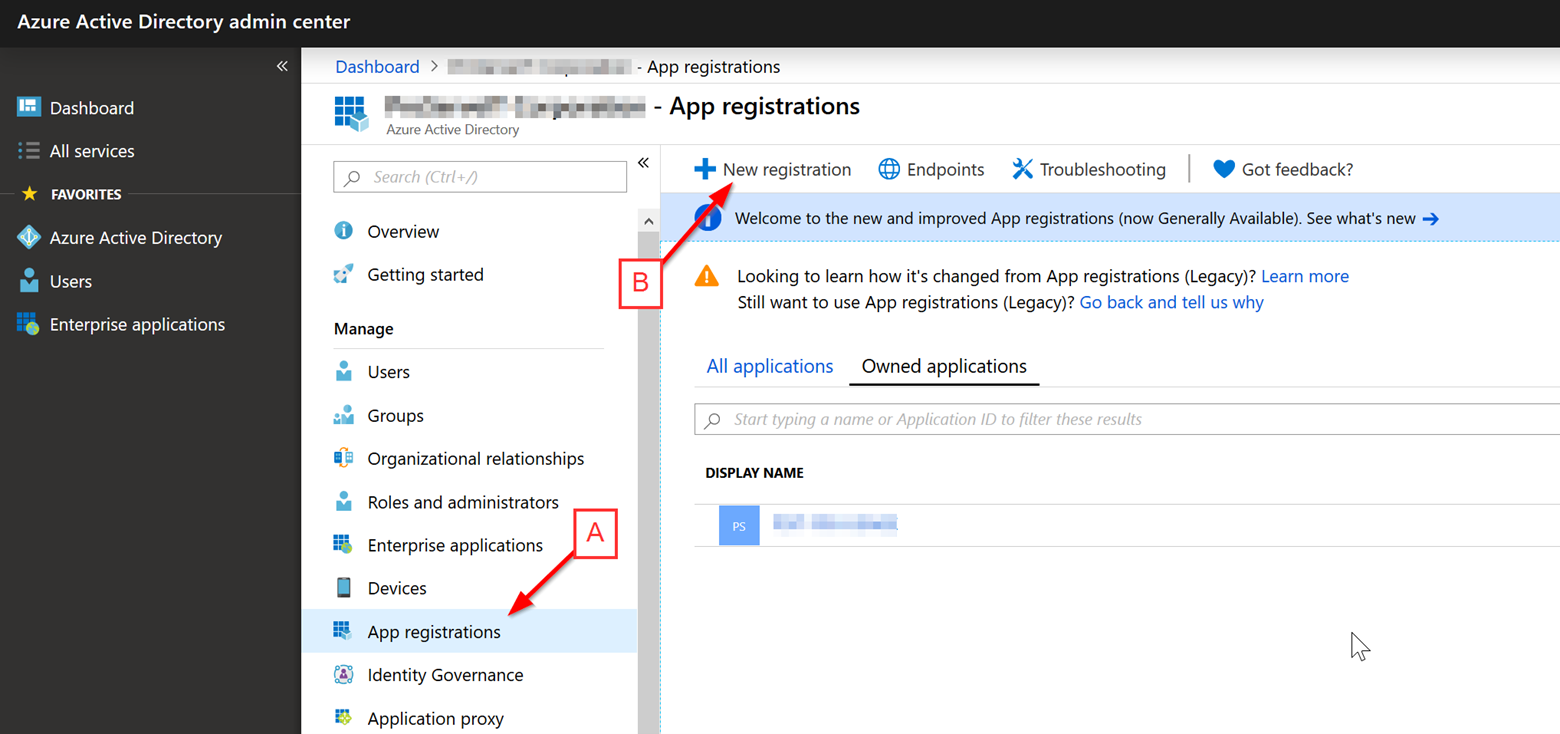
Log in to the Azure AD Admin portal and click on “App Registrations”. You should see an option to add a new registration as shown below.
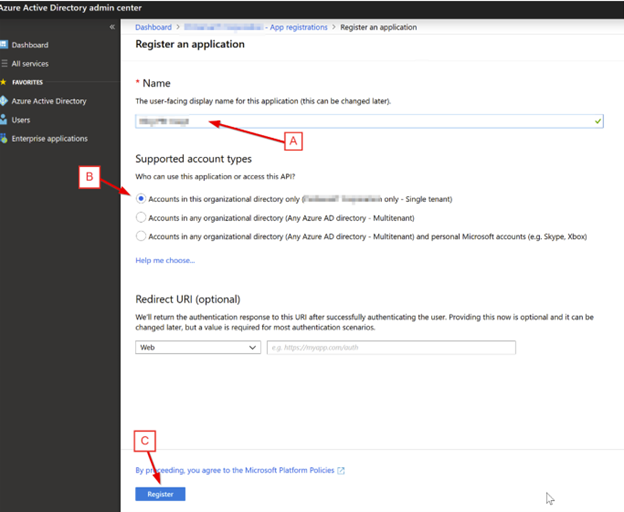
Register Your Azure AD Application
Enter the Application Name, Select the supported account type (default) and click “Register”.
Add and Request API Permissions
Once the APP is registered, now you need to add the permissions that will allow the app to connect to the Power BI service. To do this, open the app and click API permissions. You will see an option “Add a permission”, click “Add a permission”.
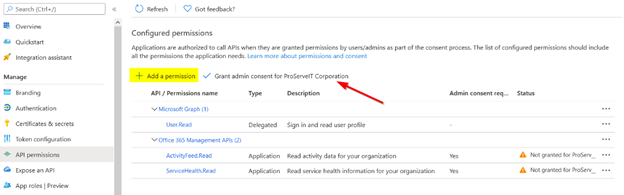
Make sure to check off “Grant admin consent” to be able to use the Tenant permissions.
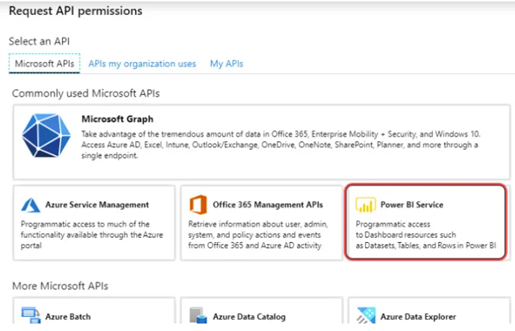
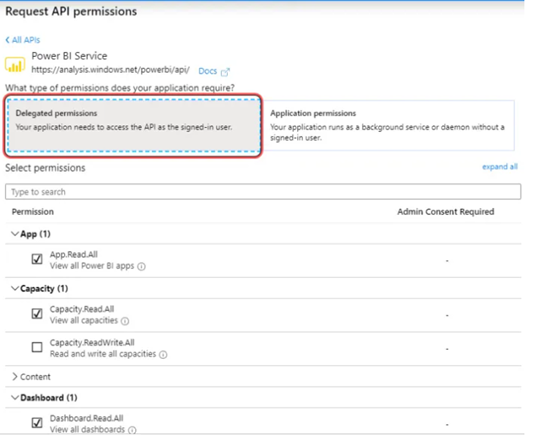
Under “Request API Permissions”, click “Power BI Service”. Make sure to select either “Delegated Permissions” or “Application Permissions” based on your preference and select at least one permission. Here I selected 3 permissions. Once permissions are selected, click “Add Permissions” and you are ready to use the app to authenticate to Power BI.
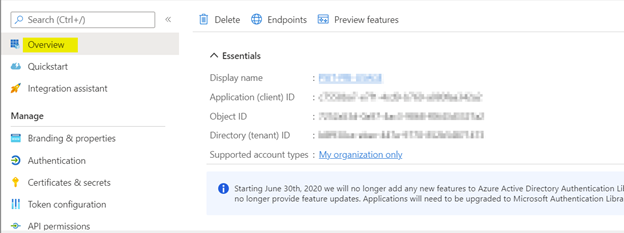
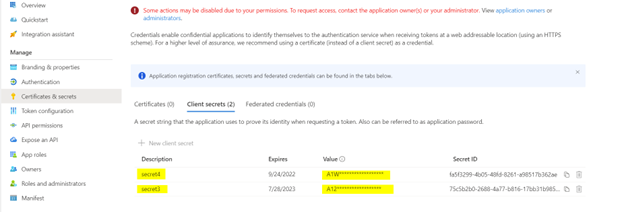
Once the app is created, go to the Overview page, and write down the Client ID and Tenant ID on a sticky note for later use. Also, create secrets that will be used in linked services later for authentication.
Create an Azure AD Security Group and Enable the PowerBI Admin Settings
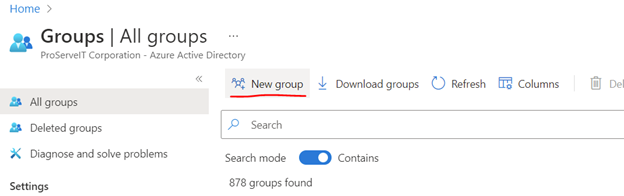
To create a security group, go to the Azure Active Directory and select “Groups”, and then select add a New Group. Fill in the required details and create the group.
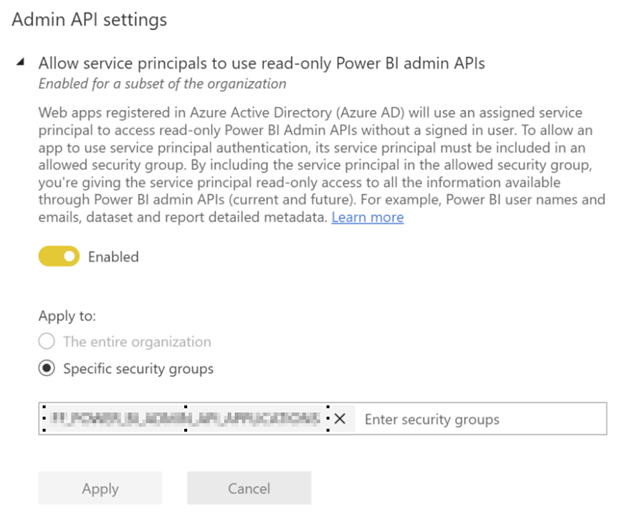
Once the group is created, go to Power BI Online and open the admin portal. You need Power BI admin access to make changes. Go to “Tenant Settings” in the admin portal and allow the service principals to use Power BI APIs and add the security group created above under the specific security group section.
Step 2: Create an Incremental Pipeline in Azure Data Factory
Create Linked Services
A linked service will connect to the source Microsoft Power BI Graph API. To create a linked service, go to “Manage” in ADF and click “Linked services” in the left pane and then click “+ New”.
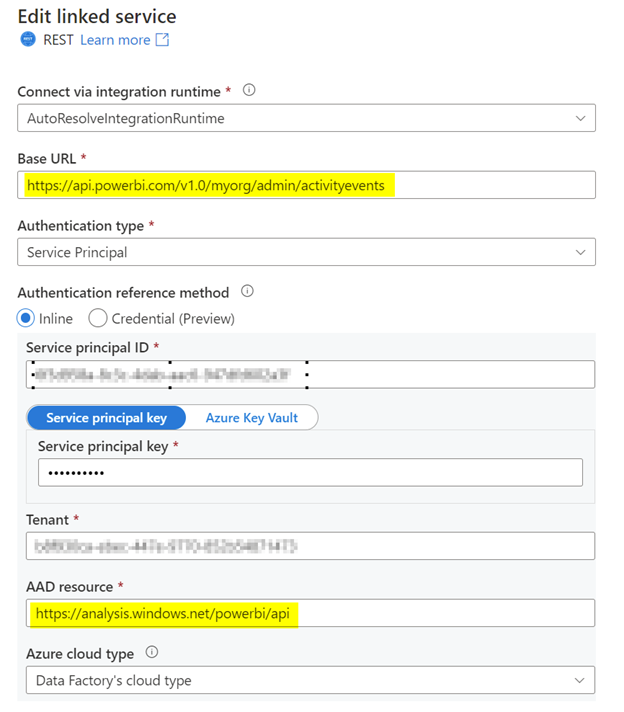
Source Linked Service: Type “Rest API” in the search bar and select “Rest” and press “Continue”. A new window will be opened just like below. Fill in the details and select “Create”.
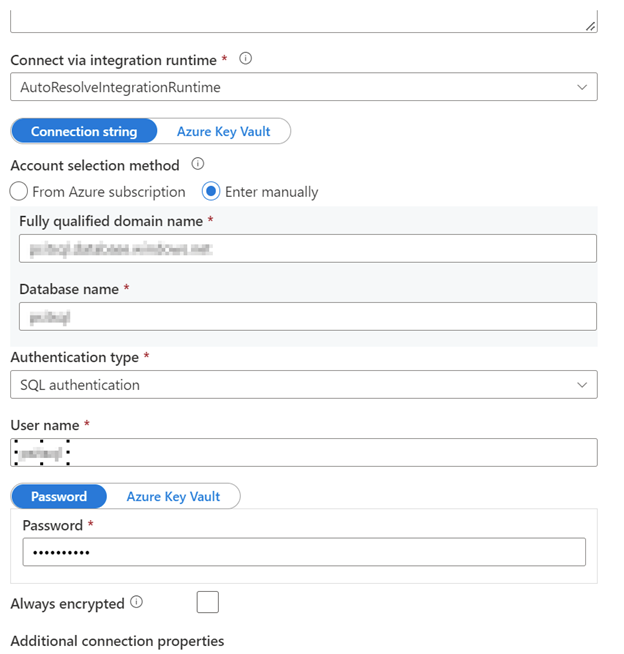
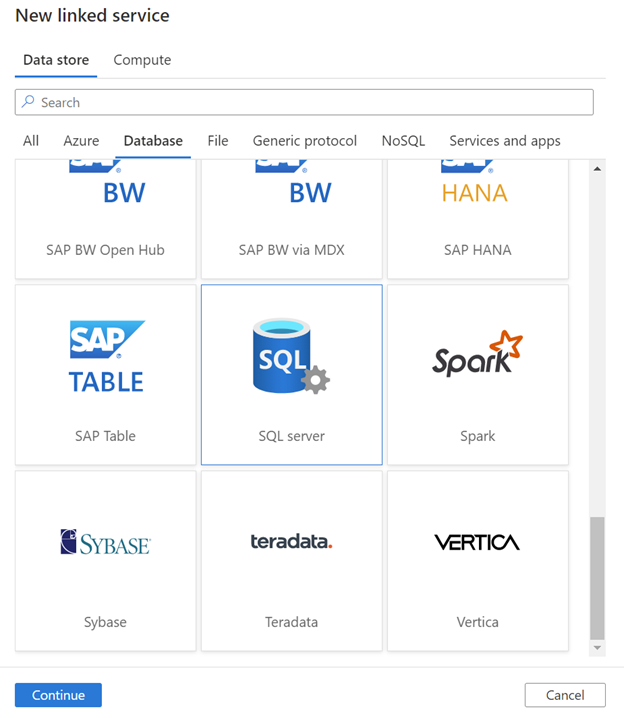
Sync Linked Service: I am syncing the data in the SQL table so we will create an Azure SQL Server Linked Service, but you can sync it to Datalake, CosmosDb, etc. there are different sync options made available to us by Microsoft and you can choose any one of them. Here instead of typing “Rest” select “SQL Server” and click on “Continue”.
Fill in the required Server Details as shown below and the Linked Service will be ready to use.
Create Source and Sink Datasets
Once the linked service is created, we will now create datasets using the linked service.
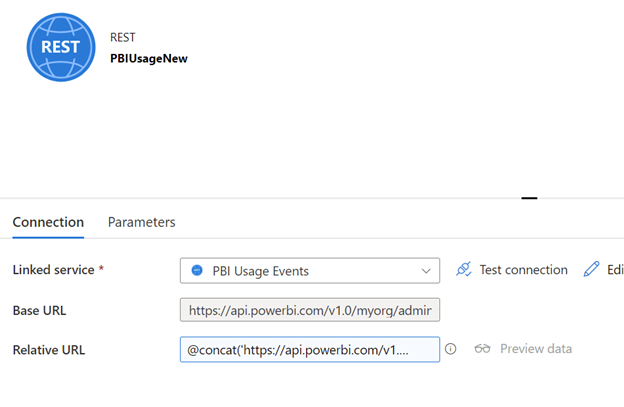
Source (Rest) Dataset:
The base URL is the same URL we used when we were creating the Linked service. A relative URL is used when we want to add some specific filters to the API. Here I am using the below relative URL which filters the API for 1 day (startDateTime – endDateTime). I have created 3 parameters that will be added to the dataset while the pipeline is running.
@concat('https://api.powerbi.com/v1.0/myorg/admin/activityevents?startDateTime=',dataset().tick,dataset().start_date,dataset().tick,'&endDateTime=',dataset().tick,dataset().end_date,dataset().tick)
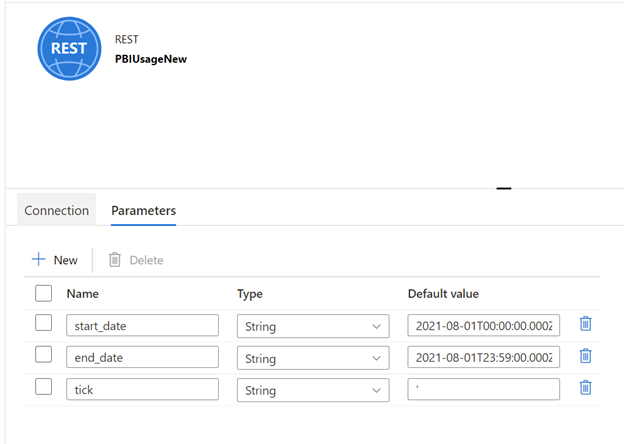
Start_date and end_date will be passed to the dataset through the variables in the pipeline. I have created a parameter tick to make sure that the data factory doesn’t consider a tick that has to be passed to the dataset with a start/end of the string.
Variables:
Start_date :
@formatDateTime(startOfDay(getPastTime(1,'Day')),'yyyy-MM-ddTHH:mm:ss.fffZ')
End_date: @formatDateTime(addminutes(addhours(startOfDay(getPastTime(1,'Day')),23),59) ,'yyyy-MM-ddTHH:mm:ss.fffZ')
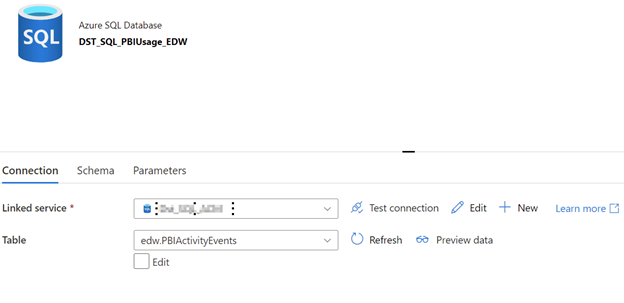
Sink (SQL) Dataset: I will create a dataset that will sync the data in a table called “edw.PBIActivityEvents” in the SQL database.
Create a Pipeline
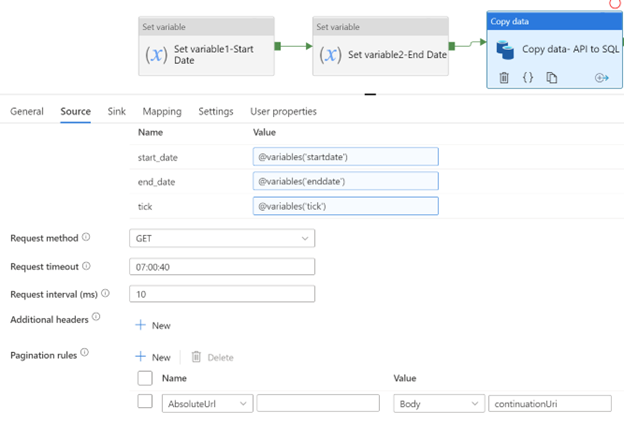
I will create a simple Pipeline with 2 variables and a Copy Data activity. Both the variables are passed in the copy activity as shown in the below image. The copy data activity will hold the above-created source and sink datasets which will copy the data from the source to the sink. One thing to note here is since the source is a Rest API it will hold a subset and not all the data, so we need to pass a continuation token (pagination rule as shown below) to fetch all the source data available in the API.
You can modify the above pipeline to do data transformations or to do an incremental load by storing the data in staging and referencing it to the final dimensionally modeled tables. With the help of the data loaded in SQL, you can create a Power BI report to show the usage metrics.
Thank you for all the questions in our First Power BI Usage Metrics Across All Workspaces: Step by Step, that helped us come up with a different approach for Power BI usage metrics. Leave your comments below!
Related Blogs:
Load Excel Spreadsheets to Structured Databases with Azure Data Factory: Step-by-step
Power BI Data Sources: A Detailed Look at Loading Your Data Into Power BI
Power BI Usage Metrics Across All Workspaces: Step by Step
Bring Your Data Processes Together!
At ProserveIT, we are experts at working with Synapse analytics and have helped our clients to choose and implement the model that best suits their requirements. For more information on how we can help you save money and bring all the processes related to data under the same umbrella, don’t hesitate to give us a shout at cloud@proserveit.com.
.png?width=850&name=Shipping%20%26%20Inventory%20Reporting%20-%20Power%20BI%20Case%20study%20(5).png)

From the 1980's, when his father used to hand down old computer equipment, to now, Scott Sugar has always had a fascination with technology. The ability to communicate with people, regardless of distance or location, is, in Scott's opinion, one of the best things about tech. With over 20 years of experience in the IT industry, and 17 years at ProServeIT, Scott's areas of expertise include data & analytics, and IT operations, monitoring, and alerting. Scott heads up ProServeIT's Ho Chi Minh City, Vietnam office. He has spent the majority of his adult life in Asia, and speaks 3 languages.


Comments