
How Can Businesses Cut Cloud Costs Without Losing Performance?
How do you make the most of your Enterprise Business Intelligence? Are you looking for new ways to look into harnessing and distilling your data into something that can be used to make better business decisions? Do you have trouble combining multiple data sources, like trying to get a .csv and .xls file to “talk” to each other?
If you’ve ever found yourself asking these questions, this blog is for you. In it, we’re going to show you how you can get the most from your organization’s valuable data using Power BI.
If you’re an IT professional and you’re looking for more of the “hows” of Power BI, click here for your blog!
What is Power BI?
Before we jump into how you can extract valuable enterprise business intelligence into Power BI reports, let’s talk about what exactly Power BI is.
Power BI is a suite of business analytics tools that can help you to distill, delve deeper, and dive into your data. This unique platform helps anyone in your organization with a Power BI license to visualize and analyze data with greater speed, efficiency, and understanding.
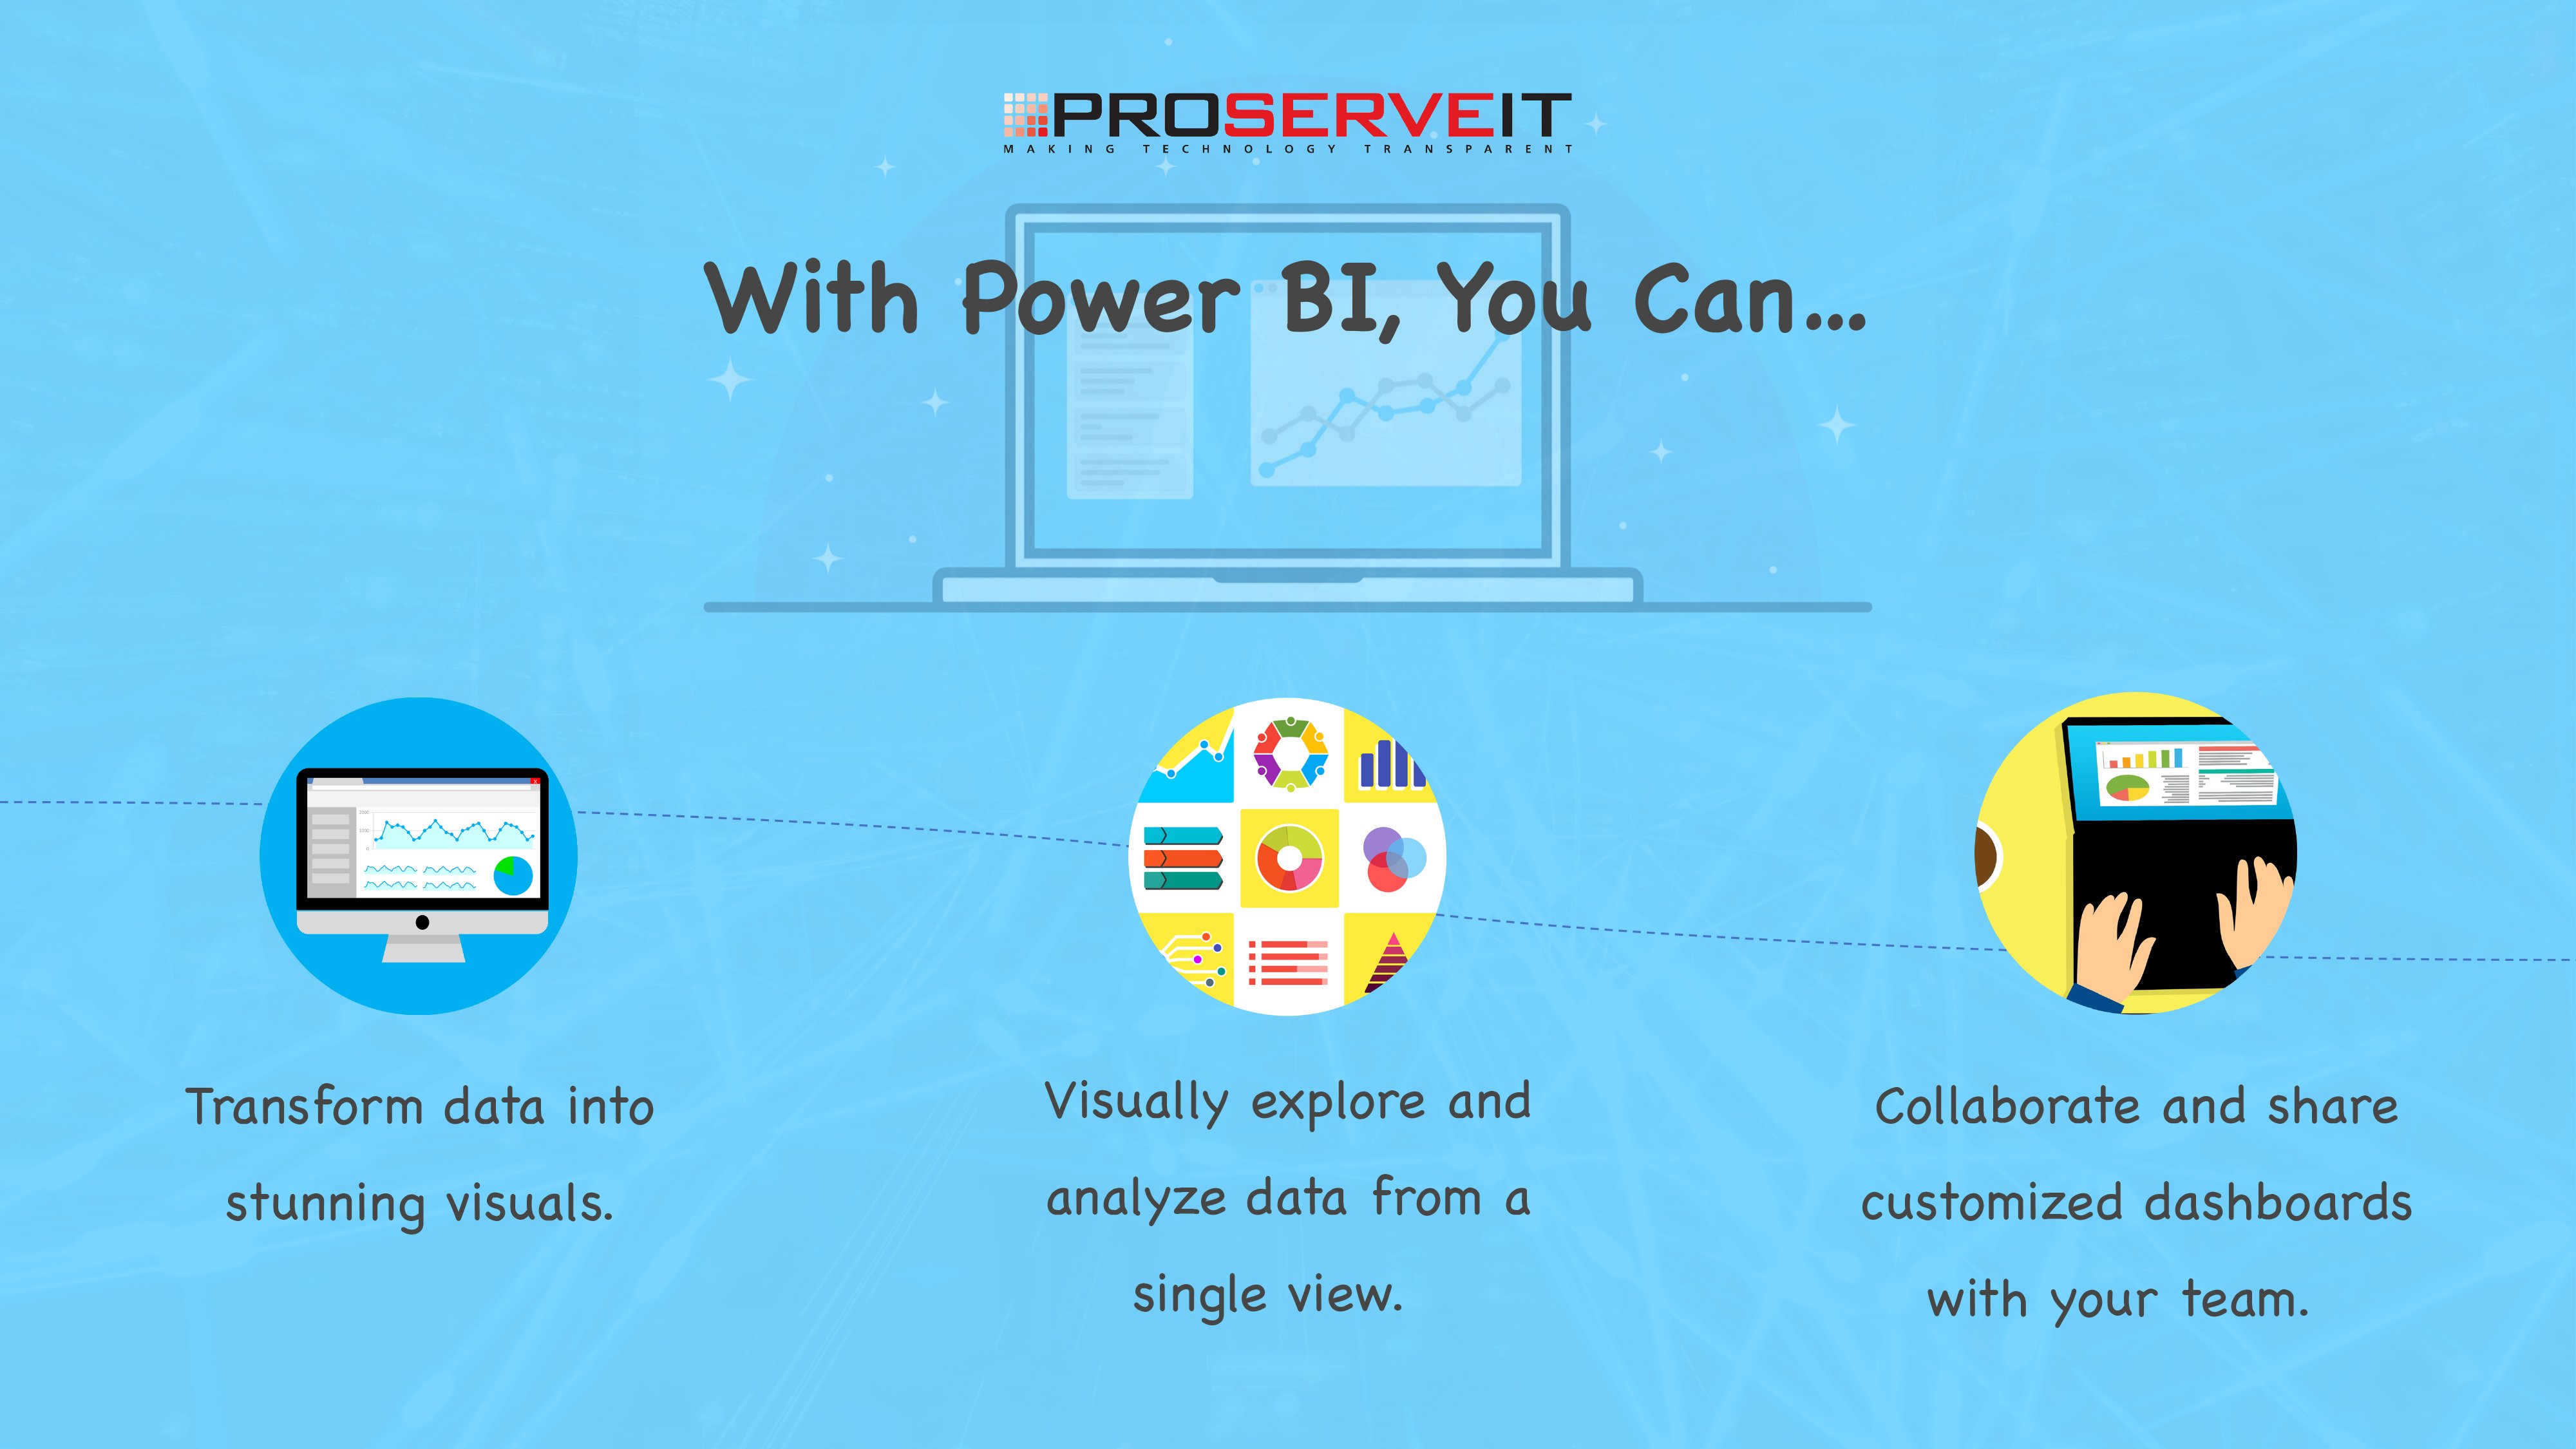
With Power BI, you can:
- Transform data into stunning visuals
- Visually explore and analyze data from a single view.
Collaborate and share customized dashboards with your team.
Simply put, you can use Power BI to predict needs and trends, create and manage sales and marketing campaigns, make better financial and business decisions, see real-time dashboards and reports, and harness your data into meaningful enterprise business intelligence that you can act on.
Check out this short introductory video on Power BI below to learn more:
Illustrating Enterprise Business Intelligence with Power BI
So, now that you know a little more about Power BI, let’s take a moment to do a little role-playing here. Let’s assume, for the sake of this example, that you are the sales manager of your company. Before the start of your fiscal year, you planned out your sales projections in an Excel file. It’s now the end of your fiscal year, and your CEO and CFO are looking for an update of your actual sales vs the number of sales you predicted at the beginning of the year.
As you go to pull the reports, you realize that the reporting system your organization uses only allows you to access the data in a CSV format. So, you’re left with two file types that don’t exactly talk to each other – CSV, and Excel. So, how do you extract the projected and actual data into a single, cohesive report?
This is where Power BI reports comes into play.
By pulling both the CSV and Excel files that you already have to work with into Power BI, not only can you get these two previously incompatible files to talk to each other, but you can also manipulate that data and have the ability to drill down into why the numbers are the way that they are, too. In this way, Power BI breaks down these data silos and becomes a central data repository for your organization. Best of all, Power BI is real-time, so once you’ve set up your reports in Power BI, the data will update automatically whenever the original source is updated.
Pull Enterprise Business Intelligence From Several Sources
In the example above, we’ve talked about having to get .csv and .xls files to “talk” to each other using Power BI as a type of “common denominator”. This is pretty common – we don’t always have flexibility for the format we’re going to choose for our data – different systems often have different formats for their data.
But, when it comes to data connectivity, Power BI has a rich and diverse set of native data connectors, and the list of these data connectors keeps growing as Microsoft adds more and more data compatibility into the Power BI platform. In the GIF below, you’ll see just some of the connectors that you can feed into Power BI to consolidate your data:
Enterprise Business Intelligence – Not Just Reporting
Power BI isn’t just known for being able to put out visually appealing reports. With it’s deep-dive capabilities, Power BI also provides collaboration opportunities, and coaching and mentoring opportunities, too! Check out this short video clip below on the other capabilities of Power BI, or register to watch our latest demo-based Power BI webinar for business decision-makers and executives.
Turn Your Enterprise Business Intelligence Into Gold – Today!
At ProServeIT, we believe quite strongly in helping our customers turn their raw data into analytics “gold”. Your data tells a story and gives you a complete picture of what’s happening in your organization – but sometimes, that story gets lost in translation, and you need a solid business intelligence tool, like Power BI, to help clarify the story for you.
Interested in understanding more about how Power BI can help you make the most of your Enterprise Business Intelligence? Not a problem! ProServeIT’s Power BI Discovery Session for management and executives can help you understand the capabilities of Power BI as they pertain to your organization. Together with our experts, you’ll learn how you can take advantage of Power BI, and the many benefits of using such a powerful business intelligence suite in your organization. At the end of this one-day session, we’ll provide you with a list of our recommendations on where to start your Power BI journey.

Related:

ProServeIT Corporation is a Toronto-based, leading IT solutions provider with over 20 years of experience helping businesses across various industries leverage technology to drive growth, enhance efficiency, and boost productivity. The blog and articles are authored by ProServeIT’s team of seasoned experts, sharing their insights and knowledge to help businesses stay ahead in the fast-changing tech landscape.


Comments