
Big Data Analytics: How Business Leaders Can Turn Data into Actionable Strategies
by Scott Sugar
Are you comparing Microsoft Power BI and Excel and wondering which one your organization should be using? Trying to determine the best business analytics tool between the two? If you answered yes to either of these questions, this blog is for you – in it, we’ll briefly compare both Power BI and Excel and give you some key questions you should be asking yourself in order to choose the best tool for your organization.
Comparing Power BI and Excel – The History of These Two Tools
When comparing these two different tools, it's often useful to try and understand the intended purpose of each tool before making your decision. Read below to learn a bit about the history of each tool and what its intended purposes were:
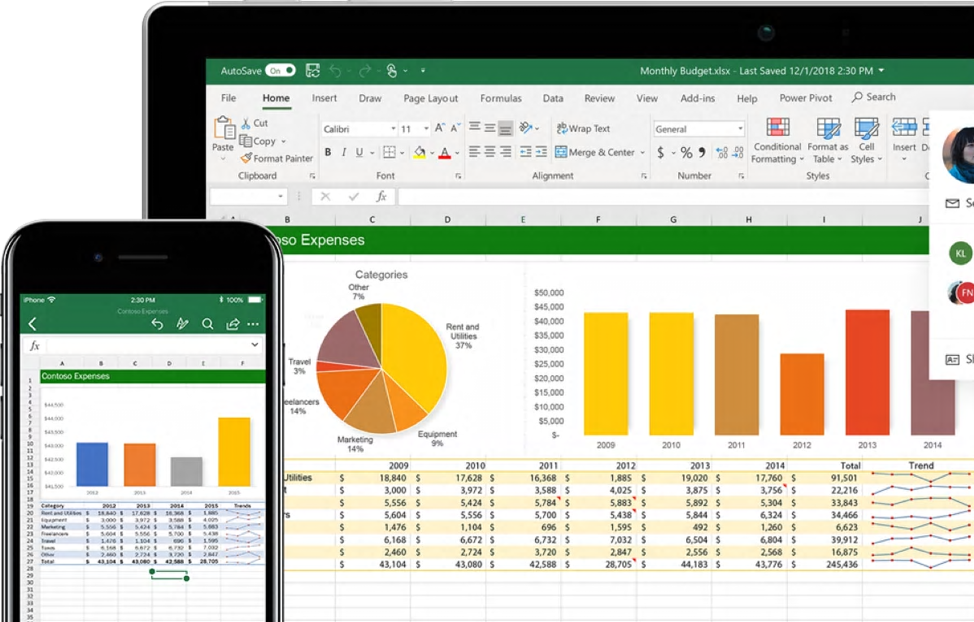
Microsoft Excel
Created in 1987, Microsoft Excel was meant to be a traditional spreadsheet application. As a traditional spreadsheet, it allowed users to reference specific cells (or groups of cells), and do a variety of calculations (simple and complex). Given its long life, Microsoft Excel has a vast array of features and most business users feel very comfortable using it. That being said, Microsoft Excel does not have complex lookups, add-ons, or manual copy/paste, so it is difficult to build relationships with other tables/data sources. This, therefore, typically limits users to working with a series of disconnected tables.
Microsoft Power BI
Relatively new to the scene, Microsoft Power BI was created in July 2015, and is focused on data ingestion, easily building relationships between data sets, alerting, and publishing/sharing reports and dashboards. A full business analytics solution with much more collaboration and sharing capabilities built in, Microsoft Power BI helps organizations to visualize their data, share insights across the organization, and encourages connection between hundreds of data sources to create a single cohesive report.

Want to see a short overview of Power BI? Check out this video below:
Comparing Power BI and Excel – an Example Scenario
Let’s look at an example scenario that will help you to compare Power BI and Excel.
You've been tasked with creating a new sales report. You open up your CRM, export your closed deals to CSV, and open it up in Excel. A bit of cleanup, a few formulas, format as table, a quick chart, save as an excel workbook, and things are looking good. You can see a customer ID number, the deal name, the date the deal closed, projected and actual revenue, and time and material costs. You send it to your boss - they love it, but they have a comment: "This is great work! Now, can we see a sales total by customer name? I only see a customer ID number".
To help your boss, you need to go back to the CRM, export all the CRM customers to CSV, open the CSV in Excel, and copy/paste customer ID number and customer name columns into the first excel workbook that has the closed deals data. Then, you need to create a lookup formula, or do some manual copy/paste to replace the customer ID number in the deals data with the customer name from the customer data, create a quick pivot table - now you have actual sales by customer name.
You open up an email to send the report back to your boss, but you have a few moments of hesitation... you start thinking, what's going to happen next month when your boss wants this report again? Will you forever be spending time every month exporting data to CSV, slightly modifying formulas, formatting tables, and sending emails with Excel attachments? What if your boss wants to see this data every week? What if someone asks for the sales data to be connected to your timesheet data? - that's a totally different system - does it even export to CSV?
These questions make you begin to wonder if Excel really is the best business analytics tool for your organization. Maybe there’s something else that’s out there that can do all this stuff with a lot more ease and, dare you begin to hope, automation…
Enter Power BI.
Questions to Ask Yourself When Comparing Power BI and Excel
Below, we’ve come up with some questions that should help you to compare Power BI and Excel and determine what might be the best business analytics tool for you to use:
- Do you want to be able to share reports with a broad range of users?
- Do you want to ingest large amounts of data?
- Do you want to create a report based on multiple tables/data sources?
- Do you want to be able to cross filter between visualizations?
- Are you spending recurring time on manual data retrieval/cleaning/transformation/reporting processes?
If you answer "yes" to any of the above questions, then you should look at building your report process within Power BI.
- Do you want to rapidly explore a single/summarized data table?
- Do you want deep customization of tabular style reports?
If you answer "yes" to any of the above questions, then you should look at using Excel.

Get Started with MS Power BI and/or Excel Today
If you've been tasked with creating, updating, or maintaining reports for your organization and you’re considering Excel or Power BI for the job, our upcoming webinar is for you! See details here and register to join live or get a recording >>

ProServeIT Corporation is a Toronto-based, leading IT solutions provider with over 20 years of experience helping businesses across various industries leverage technology to drive growth, enhance efficiency, and boost productivity. The blog and articles are authored by ProServeIT’s team of seasoned experts, sharing their insights and knowledge to help businesses stay ahead in the fast-changing tech landscape.


Comments